Metabolism overview, enzymes and energy carriers
A concise review of metabolic pathways, key enzymes and energy carriers for medical students.
DefinitionMetabolism
Figure 1Metabolism pathways (partly labeled)
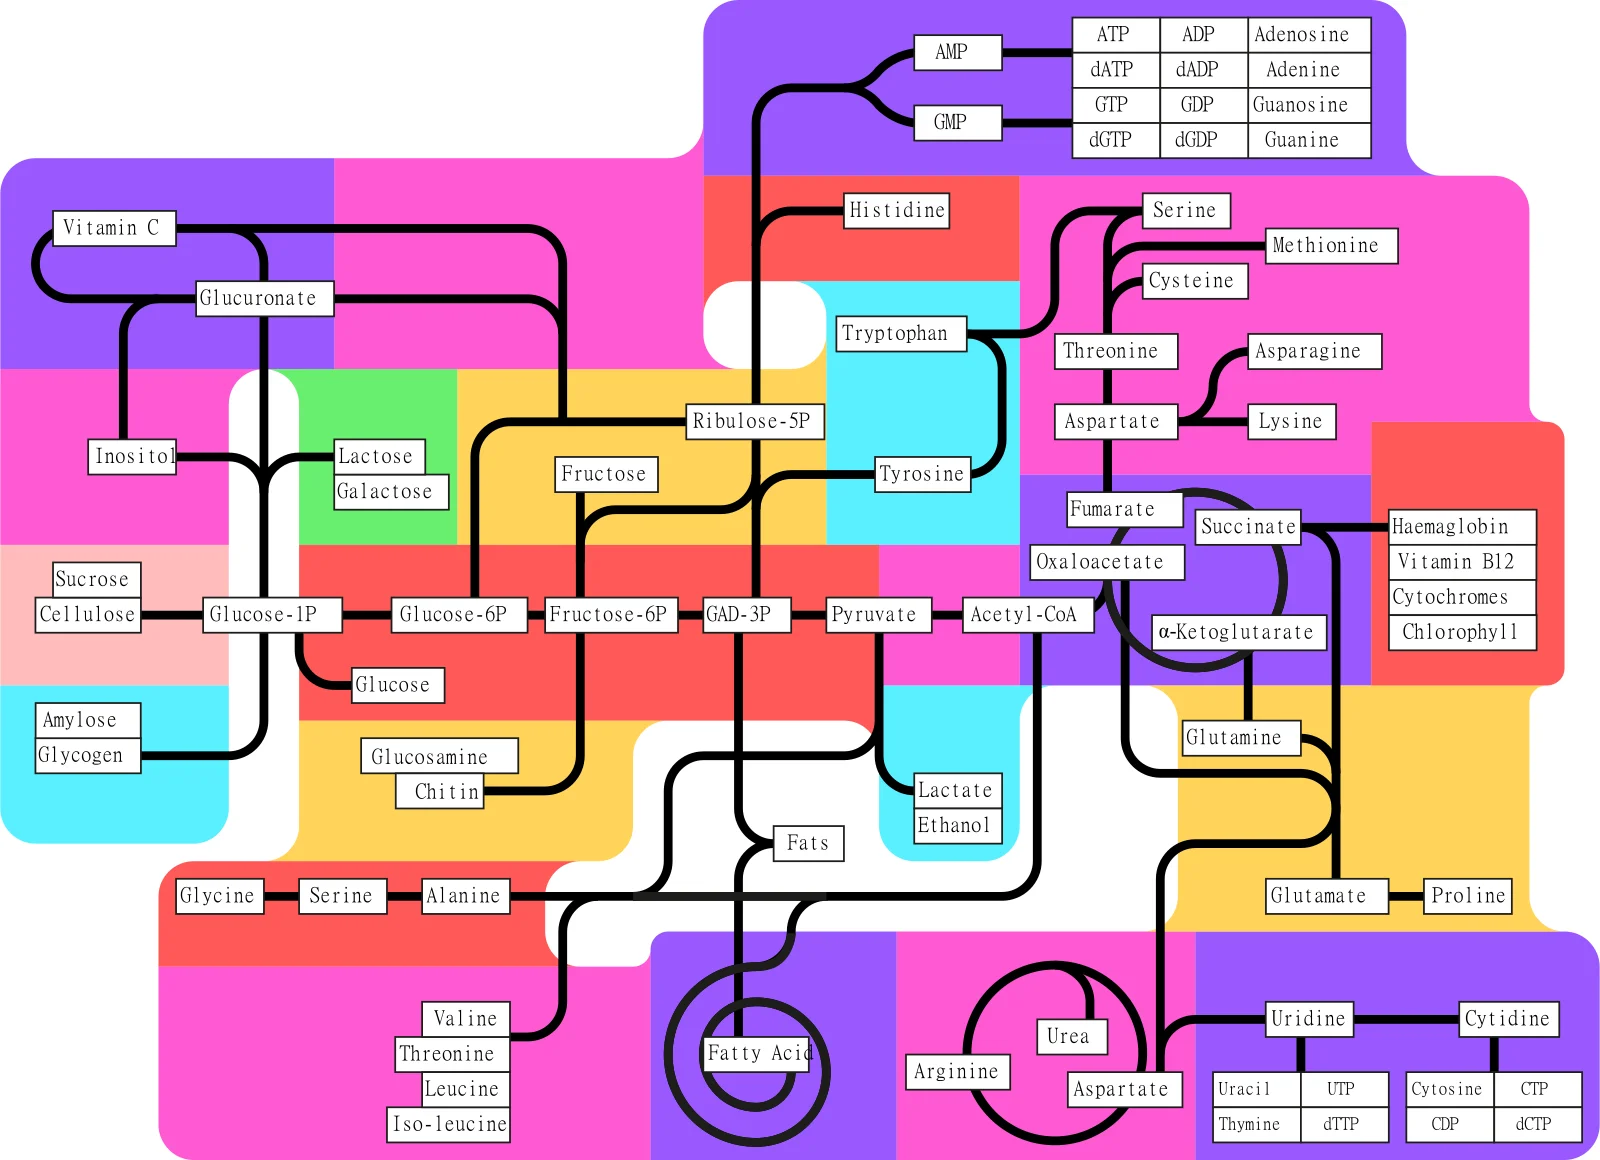
Long description
Illustration for biochemistry/metabolism overview enzymes and energy carriers from Wikimedia Commons, titled 'Metabolism pathways (partly labeled)': Metabolism overview partly labeled. The author and licence are given in the credit line.

Metabolism is divided into catabolism, the breakdown of molecules to release energy, and anabolism, the synthesis of complex molecules using that energy. The central energy currency of the cell is adenosine triphosphate (ATP), produced mainly through glycolysis, the tricarboxylic acid (TCA) cycle and oxidative phosphorylation. Cofactors such as nicotinamide adenine dinucleotide (NAD⁺/NADH) and its phosphate form (NADP⁺/NADPH) shuttle electrons between reactions, linking catabolic and anabolic pathways.
Enzymes are biological catalysts that lower the activation energy of reactions, allowing them to proceed at physiological rates. Key terms:
- Substrate: the molecule an enzyme acts upon.
- Product: the molecule formed after the reaction.
- Active site: the region where substrate binding and catalysis occur.
- Cofactor: a non‑protein chemical (e.g., metal ion, NAD⁺) required for enzyme activity.
- Allosteric site: a regulatory site distinct from the active site; binding here modulates enzyme activity.
- K_m (Michaelis constant): substrate concentration at which the reaction rate is half its maximum; a measure of affinity.
- V_max: maximum rate achieved at saturating substrate.
Enzyme kinetics are often described by the Michaelis–Menten equation:
Rate = (V_max × [S]) / (K_m + [S])
Regulation of metabolic fluxes frequently occurs at the level of rate‑limiting enzymes, the slowest step in a pathway that determines overall throughput.
| Pathway | Rate‑limiting enzyme | Key function | Regulatory notes |
|---|---|---|---|
| Glycolysis | Hexokinase / Glucokinase | Phosphorylates glucose to glucose‑6‑phosphate, trapping it in the cell | Inhibited by ATP, activated by glucose |
| Pentose phosphate pathway (oxidative branch) | Glucose‑6‑phosphate dehydrogenase | Generates NADPH and ribulose‑5‑phosphate | Activated by NADP⁺, inhibited by NADPH [1] |
| Tricarboxylic acid cycle | Citrate synthase | Condenses acetyl‑CoA with oxaloacetate to form citrate | Inhibited by ATP and NADH |
| Oxidative phosphorylation | Complex I (NADH:ubiquinone oxidoreductase) | Transfers electrons from NADH to ubiquinone | Dependent on proton motive force |
Glycolysis begins with hexokinase (or glucokinase in liver) and ends with pyruvate kinase. The net gain is two ATP molecules per glucose, after the investment of two ATP in the early steps, and the production of two NADH molecules during the oxidation of glyceraldehyde‑3‑phosphate. [1]
The pentose phosphate pathway supplies NADPH for reductive biosynthesis and ribose‑5‑phosphate for nucleotide synthesis. Its oxidative branch is controlled by glucose‑6‑phosphate dehydrogenase, which also links the cytosolic NADP⁺/NADPH pool to the mitochondrial NADH/NAD⁺ system through the non‑oxidative branch that interconverts ribulose‑5‑phosphate with glycolytic intermediates. [1]
The TCA cycle generates NADH and FADH₂, which feed the electron transport chain. Citrate synthase is the first enzyme of the cycle and is often rate‑limiting, especially under high energy demand.
In oxidative phosphorylation, Complex I is the entry point for NADH‑derived electrons. Its activity is tightly coupled to the proton gradient and ATP synthesis.
A patient with a hexokinase deficiency presents with hypoglycaemia. Because hexokinase is the rate‑limiting step in glycolysis, glucose cannot be efficiently phosphorylated, leading to impaired ATP production in tissues that rely on glycolysis.
Glycolysis Overview
- Glucose uptakeTransport into cell
- Hexokinase activityPhosphorylation to G6P
- Question: Is ATP high?
Yes
- Hexokinase inhibition
No
- Proceed to G6P isomerase
Clinical pearlNADPH’s dual role
DefinitionMitochondrial oxidative phosphorylation
The central hub of cellular energy production is the mitochondrion, where the majority of ATP is generated through oxidative phosphorylation. In the mitochondria, oxidative phosphorylation couples ATP production to the energy released by the reduction of oxygen to water using electrons carried by NADH, producing approximately 28 further ATP molecules from the two molecules of pyruvate derived from the passage of a single glucose molecule through the glycolytic pathway. Pyruvate enters the mitochondria through the pyruvate carrier and is oxidised and decarboxylated into acetyl CoA, producing CO₂ and NADH. Citrate, formed by joining the acetyl group of acetyl CoA to oxaloacetate, then enters the tricarboxylic acid (TCA) cycle. While this process may classically be viewed as a catabolic prelude to ATP generation by aerobic respiration, the large array of intermediates involved serve as important biosynthetic precursors, including for the synthesis of non‑essential amino acids and fatty acids. [1]
The mitochondria are the site for the universal conversion of all types of fuel substrate into ATP, with β‑oxidation pathways permitting the conversion of fats into acetyl CoA alongside the mechanisms already discussed for the utilisation of sugars and amino acids. NADH links the TCA cycle to cellular energy generation, carrying electrons to the electron transport chain (ETC) on the inner mitochondrial membrane. Upon oxidation to NAD⁺ by complex I, NADH dehydrogenase, the electrons are passed down the chain to complex IV, cytochrome c oxidase, where four electrons are passed to an oxygen molecule and combined with four protons, producing two molecules of water. [1]
In contrast, the cytoplasm is the site of glycolysis, the first step in glucose catabolism that generates pyruvate and a net gain of two ATP molecules per glucose. Glycolysis also produces NADH in the cytosol, which must be shuttled into the mitochondria for oxidative phosphorylation. The key role of the NNT and the network of interactions taking place in cytosolic glucose metabolism highlight that the pathways involved in maintenance of the NAD and NADP pools in their separate redox states are highly interconnected. Indeed, in addition to the malate‑aspartate and citrate‑α‑ketoglutarate shuttles providing separate transmission of NAD and NADP redox state between cytosol and mitochondria, a pyruvate‑malate shuttle in which the redox state of the cytosolic NADP pool is coupled to that of the mitochondrial NAD pool has also been observed. Additional complexity in these redox networks also arises from the reversibility of a number of the reactions. [1]
The cytosolic side also harbours the pentose phosphate pathway, which generates NADPH for reductive biosynthesis and antioxidant defence, and the serine‑glycine one‑carbon cycle, which feeds one‑carbon units into the folate cycle. These pathways are tightly linked to mitochondrial function through the exchange of metabolites and cofactors, ensuring that the cell can adapt to varying energetic and biosynthetic demands.
DefinitionATP
The bulk of ATP is produced in mitochondria via oxidative phosphorylation, which yields about 28 ATP molecules per glucose molecule after glycolysis. This figure reflects the combined contribution of the TCA cycle, the ETC and ATP synthase. In the cytoplasm, glycolysis generates a modest net gain of two ATP molecules per glucose, providing a rapid but low‑yield source of energy that is essential during hypoxia or in cells with high glycolytic rates, such as proliferating cancer cells. [1]
ATP synthesis is tightly coupled to the proton motive force generated by the ETC. Electrons from NADH and FADH₂ flow through complexes I–IV, pumping protons across the inner mitochondrial membrane. The resulting electrochemical gradient drives ATP synthase (complex V) to phosphorylate ADP to ATP. The coupling efficiency is high; however, the process is not without cost. The reduction of oxygen to water in the mitochondria comes at the cost of oxidative stress. NAD and NADP lie at the heart of the balance between energy supply and ROS defence, and imbalance between the two leads to cellular dysfunction. [1]
ATP is consumed by a wide array of processes: muscle contraction, active transport across membranes, synthesis of macromolecules, and signal transduction. The high‑energy phosphate bonds of ATP are hydrolysed to ADP and inorganic phosphate, releasing energy that is harnessed by enzymes to perform work. The rapid turnover of ATP (half‑life of seconds) necessitates continuous synthesis to meet cellular demands.
The rate of ATP production is regulated at multiple levels. Substrate availability (glucose, fatty acids, amino acids) determines the flux through glycolysis and the TCA cycle. Hormonal signals such as insulin and glucagon modulate enzyme activities. Additionally, the redox state of NAD⁺/NADH and NADP⁺/NADPH influences the balance between catabolic and anabolic pathways, ensuring that energy production matches biosynthetic needs. [1]
Impairments in mitochondrial ATP production underlie a range of metabolic disorders, including mitochondrial myopathies and neurodegenerative diseases. In cancer, the Warburg effect describes a shift from oxidative phosphorylation to glycolysis, even in the presence of oxygen, leading to altered ATP production rates and changes in NAD(P)H fluorescence lifetime. Understanding these shifts is critical for developing targeted therapies that exploit metabolic vulnerabilities. [2]
DefinitionNADH
NADH is generated mainly in the mitochondria during the citric acid cycle, where enzymes such as isocitrate dehydrogenase, α‑ketoglutarate dehydrogenase and malate dehydrogenase oxidise substrates and reduce NAD⁺ to NADH. In the cytosol, glycolysis produces NADH when glyceraldehyde‑3‑phosphate is oxidised by glyceraldehyde‑3‑phosphate dehydrogenase. The reduced cofactor then transfers electrons to complex I of the ETC, a process that is tightly coupled to proton pumping and ATP production.
During pathological states such as ischaemia, the citric acid cycle can reverse and consume NADH, while the NAD‑dependent nicotinamide nucleotide transhydrogenase (NNT) may oxidise NADPH to produce NADH when the membrane potential collapses. Lactate dehydrogenase can also run in reverse, using lactate as a substrate and producing cytosolic NADH alongside pyruvate for aerobic ATP production. This illustrates the highly contrasting intracellular roles of the NAD and NADP pools and their separate redox states, supported by a complex and interconnected network of pathways.
The NADH/NAD⁺ redox ratio is a sensitive indicator of mitochondrial function. Decreased ETC activity, for example following a decreased oxygen supply, limits the oxidation of NADH at complex I, increases the NADH/NAD⁺ ratio, and increases mitochondrial NAD(P)H fluorescence. Conversely, increasing ETC activity, such as by uncoupling, increases oxidation of NADH at complex I, decreases the NADH/NAD⁺ ratio and decreases NAD(P)H fluorescence. These changes can be qualitatively assessed by measuring the change in NAD(P)H fluorescence in response to a carefully chosen external perturbation. For example, the activity of the malate‑aspartate shuttle can be estimated by observing the change in NAD(P)H fluorescence distribution upon the application of its inhibitor aminooxyacetic acid (AOAA). [1]
The uncoupler carbonyl cyanide 4‑(trifluoromethoxy)phenylhydrazone (FCCP) causes maximal oxidation of the mitochondrial NADH pool by NADH dehydrogenase, whereas inhibition of complex IV of the ETC using cyanide stops respiration, maximally reducing the mitochondrial NADH pool. The intensity of NAD(P)H fluorescence observed in response to FCCP and cyanide treatment defines a dynamic range for comparing the emission intensity under untreated conditions. This resting intensity can be normalised and scaled between the minimum and maximum values obtained with the drug treatments to give an approximate value of the mitochondrial NADH/NAD⁺ ratio. [1]
Enzyme‑bound NADH exhibits a fluorescence lifetime that reflects its interaction with specific proteins. Altered NAD kinase expression has little effect on NADH levels, but intracellular bound NADPH shows a significantly longer fluorescence lifetime than bound NADH. The lifetime of enzyme‑bound NAD(P)H in a particular cell type is therefore determined by the balance of NADPH to NADH. Higher glutathione levels in cell types with increased enzyme‑bound NAD(P)H lifetime suggest that this lifetime may reflect an increased antioxidative capacity and decreased oxidative stress. [1]
Inhibition of the ETC with cyanide significantly decreases the bound NAD(P)H lifetime (to 1.9 ns without NNT and 2.1 ns with NNT). As inhibition of respiration causes accumulation of NADH, these results also suggest that the NADPH/NADH balance defines the enzyme‑bound NAD(P)H lifetime. The slightly larger value with NNT present likely reflects its primary action in converting part of the abundance of NADH into NADPH. These findings could lead to novel strategies for targeting diseases mediated by mitochondrial ROS production, highlighting the utility of NADH and NADPH fluorescence as an intrinsic biochemical probe.
The increased NADPH levels increase the mean fluorescence lifetime of enzyme‑bound species. The reasons why this cofactor should display a longer fluorescence lifetime compared to NADH within the complex environment of the cell are not obvious. Differences in the fluorescence lifetime of NADH and NADPH when bound to their respective enzymes could be caused by variations in the level of conformational restriction of the cofactors in their corresponding binding sites. Discrimination between the two cofactors is realised at the adenine end of the molecule, away from the excited state localisation. Increased understanding of the photophysics of NADH and NADPH when bound to their respective enzymes will therefore be crucial in the ongoing advancement of the NAD(P)H FLIM field.
Fluorescence lifetime imaging microscopy (FLIM) can be used effectively to differentiate between NADH and NADPH at the level of the single cell or organelle. The results suggest that enzyme‑bound NADPH possesses a significantly larger fluorescence lifetime than enzyme‑bound NADH within the cellular environment, so that the proportion of enzyme‑bound NADPH and NADH present in live tissue determines the lifetime of their combined fluorescence decay. With excitation at 700 nm and a 435–485 nm detection window, the intracellular fluorescence lifetimes of NADH and NADPH were predicted to be 1.5 ± 0.2 and 4.4 ± 0.2 ns respectively. [2]
DefinitionFADH₂
FADH₂ is produced when succinate is oxidised to fumarate by succinate dehydrogenase, and when α‑ketoglutarate is oxidised to succinyl‑CoA by α‑ketoglutarate dehydrogenase. Unlike NADH, which feeds into complex I, FADH₂ transfers its electrons directly to complex II, bypassing the proton‑pumping step of complex I. Consequently, each molecule of FADH₂ contributes fewer protons to the proton motive force and generates slightly less ATP (approximately 1.5 ATP per FADH₂ versus 2.5 ATP per NADH). This difference is important when considering the energetic efficiency of metabolic pathways. [1]
The balance between NADH and FADH₂ production is tightly regulated by the activity of the citric acid cycle enzymes and the availability of substrates. In conditions where the ETC is impaired, such as during hypoxia or mitochondrial disease, the accumulation of NADH can inhibit upstream dehydrogenases, leading to a shift in flux that favours FADH₂ production. This shift can partially compensate for reduced NADH oxidation, but the overall ATP yield is still diminished. Understanding the relative contributions of NADH and FADH₂ is therefore critical for interpreting metabolic responses to disease and therapeutic interventions.
While NADH fluorescence has been extensively studied, FADH₂ fluorescence is less intense and has a shorter lifetime, making it more challenging to detect. Recent advances in FLIM techniques have begun to allow simultaneous imaging of both cofactors, enabling the calculation of the NADH/FADH₂ ratio as an indicator of cellular redox state and metabolic health. By combining fluorescence lifetime data with biochemical assays, researchers can quantify the relative contributions of NADH and FADH₂ to the ETC and assess how these change in response to pharmacological agents or genetic modifications.
The ability to separate NADH and FADH₂ fluorescence signals will enhance our understanding of metabolic flexibility and the cellular response to stress, providing a powerful tool for both basic research and clinical diagnostics. [2]
NADPH is the primary reducing equivalent used in anabolic reactions and in the regeneration of antioxidant pools. The pentose phosphate pathway (PPP) is the main source of cytosolic NADPH; it is highly active in rapidly dividing cells such as cancers, where the NADPH produced supplies the reducing power required for lipid synthesis, a crucial requirement for cell proliferation. In mitochondria, NADPH can be generated by the oxidation of malate to pyruvate via malic enzyme, which plays an important role in insulin secretion. The availability of NADP⁺, the oxidised form, is governed by NAD kinase, the unique enzyme that phosphorylates NAD⁺ to produce NADP⁺.
The antioxidant role of NADPH is mediated through the maintenance of reduced glutathione (GSH) and thioredoxin (TRX) pools. In contrast to NAD⁺, which is directly linked to reactive oxygen species (ROS) production by the electron transport chain, NADPH can act as a pro‑oxidant when it fuels NADPH oxidase complexes. These multisubunit enzymes assemble on cell membranes and reduce molecular oxygen to superoxide, using NADPH as the electron donor. The importance of this enzyme was first recognised in white blood cells, which engulf and destroy invading pathogens by phagocytosis; the respiratory burst is driven by the superoxide produced by NADPH oxidase at the vacuolar membrane. A family of NADPH oxidases (NOX1–5 and DUOX1–2) has been identified and appears to play physiological signalling roles in wound healing, regulation of renal blood flow and the generation of otoconia in the ear, among other processes.
The balance between pro‑ and anti‑oxidant roles of NADPH depends on the relative expression of NADPH oxidase and peroxidases. NADPH oxidase can produce superoxide at a maximal rate about five times greater than a single glutathione reductase enzyme can utilise NADPH for antioxidant purposes. However, the Km for NADPH in glutathione reductase is much smaller than that of NADPH oxidase (16 µM vs. 110 µM). At physiological NADPH concentrations (~100 µM), NADPH will only power pro‑oxidative reactions to a greater extent than anti‑oxidative reactions when the concentration of NADPH oxidase is more than approximately a third of that of the peroxidases, based on Michaelis‑Menten kinetics. Proteomics data show that such levels are only encountered in phagocytic white blood cells such as neutrophils and monocytes, where the balances of NADPH oxidases to peroxidases are around 100 and 1 respectively. In all other tissues, including brain, liver, kidney, heart and lung, peroxidases outnumber members of the NADPH oxidase family by around 10 to one. Thus, in the majority of tissues, NADPH primarily acts to prevent, rather than promote, the effects of ROS. [1]
The redox state of the NADP pool can differ between cellular compartments. In HEK293 cells, the redox ratio of the NADP pool is more oxidised in the nucleus than in the cytosol, whereas the redox state of the NAD pool is the same in the two compartments. This is consistent with an absence of pentose phosphate pathway enzymes in the nucleus despite the presence of glycolytic enzymes. Modulation of NAD kinase activity can selectively alter bound NADPH concentrations, as shown by EGCG treatment in NAD kinase over‑expressing cells, which affected only bound NADPH and not bound NADH.
Hexokinase (HK) and glucokinase (GK) are the first enzymes of glycolysis, phosphorylating glucose to glucose‑6‑phosphate. HK is present in most tissues and has a low Km for glucose, allowing it to function efficiently even when glucose concentrations are low. It is also subject to product inhibition by glucose‑6‑phosphate, which provides a feedback mechanism to regulate glycolytic flux.
Glucokinase is expressed mainly in liver and pancreatic β‑cells. It has a higher Km for glucose (≈10 mM) and is not inhibited by glucose‑6‑phosphate. This allows glucokinase to act as a glucose sensor: in the liver it facilitates glycogen synthesis when glucose is abundant, while in β‑cells it links glucose uptake to insulin secretion. The kinetic properties of glucokinase enable it to respond to changes in blood glucose levels without being shut down by its product, thereby supporting the metabolic demands of these tissues.
- Assuming all cells use the same glucose‑phosphorylating enzyme – many tissues rely on glucokinase, which has distinct kinetic properties from hexokinase.
- Overlooking compartmental differences in NADPH production – the PPP is largely cytosolic; mitochondrial NADPH is produced by distinct enzymes such as malic enzyme.
- Ignoring the dual role of NADPH – while it is essential for antioxidant defence, it can also fuel pro‑oxidant NADPH oxidases in specialised cells.
- Neglecting the impact of enzyme expression levels – the relative abundance of NADPH oxidases versus peroxidases determines whether NADPH acts predominantly as an antioxidant or a pro‑oxidant.
The concepts of NADPH metabolism and hexokinase/glucokinase kinetics are applied in several clinical and research settings:
- Cancer biology – targeting the PPP to reduce NADPH supply can impair lipid synthesis and tumour growth.
- Diabetes management – glucokinase activators are explored as therapeutic agents to enhance insulin secretion.
- Immunology – understanding NADPH oxidase activity informs treatments for chronic granulomatous disease, where defective oxidase leads to impaired pathogen killing.
- Pharmacology – drugs that modulate NAD kinase activity may influence cellular redox balance and affect drug metabolism.
Glucose phosphorylation decision
- Glucose enters cellTransport by GLUT transporters
- Question: Tissue type?
Liver/β‑cell
- Glucokinase activeHigh Km, no product inhibition
- Glucose‑6‑phosphate → glycogen or insulin release
Other tissues
- Hexokinase activeLow Km, product inhibited
- Glucose‑6‑phosphate → glycolysis
- NADPH is produced mainly by the pentose phosphate pathway and malic enzyme. [1]
- Glucokinase has a higher Km and no product inhibition compared with hexokinase.
- The balance of NADPH oxidase to peroxidases determines whether NADPH acts as an antioxidant or pro‑oxidant. [1]
- Hexokinase is ubiquitous; glucokinase is liver and β‑cell specific.
- Compartmental differences exist: cytosolic PPP vs mitochondrial NADPH production. [1]
- Targeting PPP or glucokinase is a therapeutic strategy in cancer and diabetes.
Answer each one in your head first, then open the answer.
What is the main source of cytosolic NADPH?
Show answerHide answer
Pentose phosphate pathwayWhich enzyme is not inhibited by glucose‑6‑phosphate?
Show answerHide answer
GlucokinaseAt what approximate physiological concentration does NADPH favour pro‑oxidant activity in neutrophils?
Show answerHide answer
~100 µM (when oxidase exceeds peroxidases)Which tissue expresses glucokinase predominantly?
Show answerHide answer
Liver and pancreatic β‑cellsWhat is the Km difference between hexokinase and glucokinase for glucose?
Show answerHide answer
Hexokinase has a low Km; glucokinase has a high Km (~10 mM)
- Blacker TS, Duchen MR. Investigating mitochondrial redox state using NADH and NADPH autofluorescence. Free radical biology & medicine 2016;100:53-65. doi:10.1016/j.freeradbiomed.2016.08.010. Accessed .
- Blacker TS, Mann ZF, Gale JE, et al. Separating NADH and NADPH fluorescence in live cells and tissues using FLIM. Nature communications 2014;5:3936. doi:10.1038/ncomms4936. Accessed .
Figure credits
Educational content for medical students and doctors. It is not a substitute for clinical judgement or local guidelines.