Oxidative phosphorylation and gluconeogenesis
Oxidative phosphorylation links electron transport to ATP synthesis and ROS generation.
Figure 1Oxidative phosphorylation
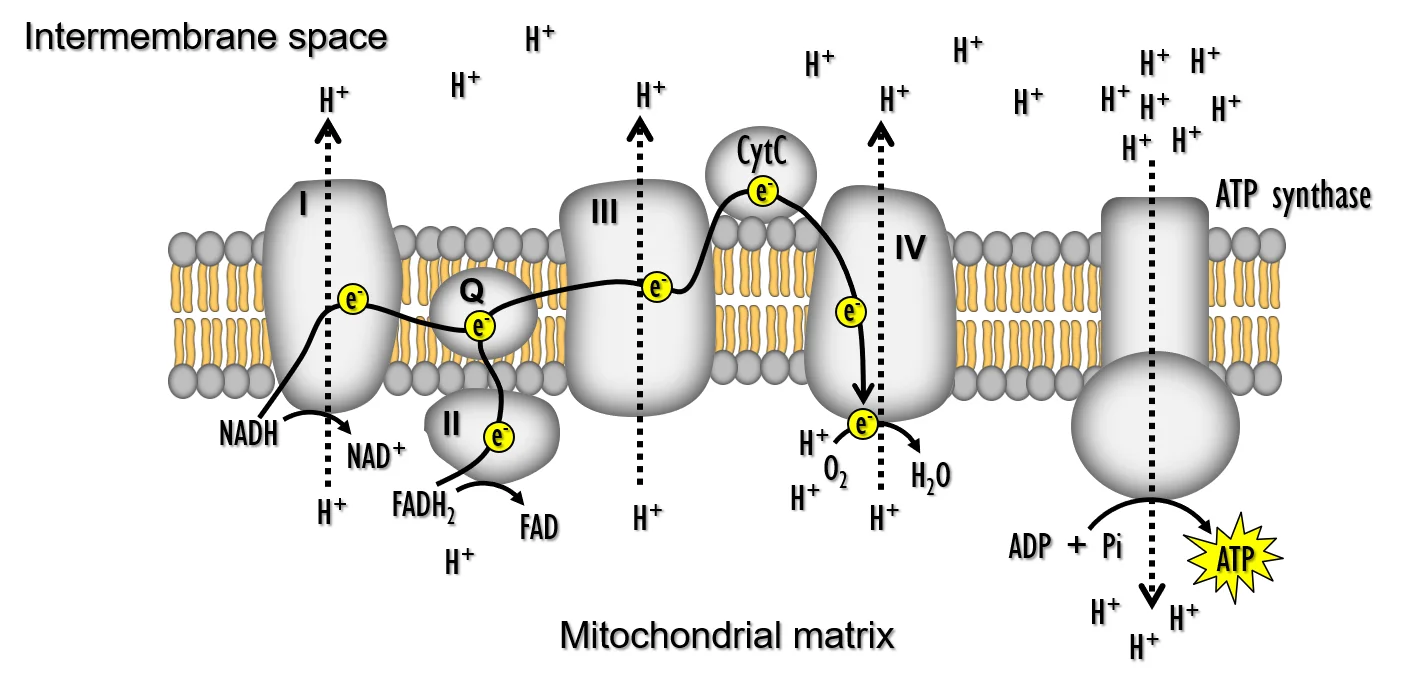
Long description
The illustration shows the inner membrane of the mitochondria and the various complexes required for oxidative phosphorylation during aerobic respiration.

Oxidative phosphorylation (OXPHOS) is the process by which mitochondria convert the energy stored in NADH and FADH₂ into adenosine triphosphate (ATP). It is carried out by a series of protein complexes embedded in the inner mitochondrial membrane, collectively known as the electron transport chain (ETC). The ETC transfers electrons from electron donors to oxygen, a process that pumps protons across the membrane and generates an electrochemical gradient. This gradient, the protonmotive force (Δp), drives ATP synthase (Complex V) to produce ATP from ADP and inorganic phosphate.
The ETC is also a major source of reactive oxygen species (ROS). When electron flow is impeded, electrons can leak to oxygen, forming superoxide and other ROS that can damage lipids, proteins and DNA. The balance between efficient electron transport and controlled ROS production is therefore central to cellular physiology and pathology.
DefinitionElectron Transport Chain (ETC)
A series of five protein complexes (I–V) that transfer electrons from NADH/FADH₂ to oxygen, pumping protons to generate ΔΨ and Δp.
The five ETC complexes are:
- Complex I (NADH dehydrogenase) – accepts electrons from NADH, reducing ubiquinone (Q) and pumping four protons into the intermembrane space.
- Complex II (succinate dehydrogenase) – oxidises succinate to fumarate, transferring electrons to Q without proton pumping.
- Complex III (cytochrome bc₁ complex) – transfers electrons from reduced Q to cytochrome c, pumping two protons.
- Complex IV (cytochrome c oxidase) – reduces oxygen to water, pumping four protons.
- Complex V (ATP synthase) – uses the proton gradient to synthesize ATP from ADP and Pi.
The cumulative proton pumping by complexes I, III and IV creates a membrane potential (ΔΨ) and a proton concentration gradient (ΔpH). Together, ΔΨ and ΔpH constitute the protonmotive force that drives ATP synthesis by Complex V. This relationship is described by the equation:
Δp = ΔΨ – (2.3 × RT/F × ΔpH)
where ΔΨ is the electrical potential, R is the gas constant, T the temperature, F the Faraday constant and ΔpH the pH difference across the membrane.
Clinical pearlProton Pumping Summary
Complex I pumps 4 H⁺, Complex III 2 H⁺, Complex IV 4 H⁺, giving a total of 10 H⁺ per electron pair transferred from NADH to O₂. [1]
The assembly of these complexes requires many ancillary proteins; defects in assembly factors can lead to inherited mitochondrial disorders.
Exam trapComplex‑Specific ROS Production
Complexes I and III are the main sites of electron leakage and ROS generation; mutations or inhibitors that impair their function increase oxidative stress. [4]
In autism spectrum disorder (ASD), studies have reported variable activity of ETC complexes. For example, 29 % of autistic subjects showed reduced activity of complex III, while 43 % had deficiencies in complexes I and V. These abnormalities were not uniformly present across all complexes, indicating heterogeneity in mitochondrial dysfunction. [4]
Certain pharmacological agents and toxins selectively block ETC complexes, providing tools to dissect mitochondrial function and modelling disease states.
- Complex I inhibitors: rotenone, piericidin A, and metformin (via inhibition of mitochondrial glycerol‑3‑phosphate dehydrogenase, which feeds electrons into Complex I). Metformin’s suppression of GPD2 elevates cytosolic NADH, inhibiting lactate dehydrogenase and pyruvate entry into gluconeogenesis, while sparing alanine pathways that bypass this shuttle. [3]
- Complex III inhibitors: antimycin A, myxothiazol, and capsaicin (which inhibits Complex I and III, leading to ROS generation). Capsaicin‑induced ROS was linked to downregulation of antioxidants such as GSH, catalase, SOD and GPx.
- Complex IV inhibitors: cyanide, azide, and potassium cyanide (KCN) block the final electron transfer to oxygen.
- Complex V inhibitors: oligomycin binds the Fo subunit, preventing proton flow and ATP synthesis.
These inhibitors are valuable in research but can cause severe cellular damage if used in vivo.
Uncouplers dissipate the proton gradient without generating ATP, thereby increasing oxygen consumption and heat production. Classic uncouplers include:
- Carbonyl cyanide m‑chlorophenyl hydrazone (CCCP) – permeates the membrane, shuttling protons back into the matrix.
- DNP (2,4‑dinitrophenol) – similar mechanism, historically used as a weight‑loss drug.
Uncoupling reduces ROS production by preventing the high ΔΨ that promotes electron leakage, but it also abolishes ATP synthesis, leading to energy crisis.
NoteClinical Relevance of Inhibitors
Metformin’s inhibition of GPD2 and MPC2 links mitochondrial dysfunction to impaired gluconeogenesis and type 2 diabetes mellitus.
| Complex | Protons Pumped | Function |
|---|---|---|
| I (NADH dehydrogenase) | 4 | Oxidises NADH, reduces Q |
| II (succinate dehydrogenase) | 0 | Oxidises succinate, reduces Q |
| III (cytochrome bc₁) | 2 | Transfers electrons from QH₂ to cytochrome c |
| IV (cytochrome c oxidase) | 4 | Reduces O₂ to H₂O |
| Total | 10 | Generates ΔΨ for ATP synthesis |
ETC Inhibition → ROS Generation
- Normal ETCEfficient electron flow, low ROS
- Question: Inhibitor present?
Yes
- Complex I/III inhibitedElectron leakage ↑
- ROS ↑Superoxide formation
- Antioxidant depletion↓ GSH, SOD, catalase
- Cellular damageApoptosis or necrosis
No
- Uncoupler presentΔΨ ↓, ROS ↓
- ATP ↓Energy deficit
Oxidative phosphorylation is a finely tuned process that couples electron transport to ATP synthesis while managing ROS production. The five ETC complexes work in concert to pump protons, creating a protonmotive force that drives ATP synthase. Inhibitors of specific complexes, such as metformin or capsaicin, can disrupt this balance, leading to altered metabolism and oxidative stress. Uncouplers, by collapsing the proton gradient, reduce ROS but also compromise ATP generation. Understanding these mechanisms is essential for interpreting mitochondrial dysfunction in diseases such as diabetes, neurodegeneration, and autism spectrum disorder.
DefinitionATP synthase
A multi‑subunit enzyme complex embedded in the inner mitochondrial membrane that synthesises ATP from ADP and inorganic phosphate using the proton motive force generated by the electron transport chain.
ATP synthase is composed of two functional domains: the F₁ catalytic sector (β, α, γ, δ, ε subunits) protruding into the matrix and the F₀ proton‑conduction channel (c, a, b, d, OSCP). The proton gradient created by complexes I–IV drives protons through F₀, causing rotation of the γ‑subunit and conformational changes in the β‑subunits that catalyse ATP synthesis. The enzyme is essential for cellular bioenergetics; loss of function leads to severe mitochondrial disease.
The β‑subunit contains the catalytic sites for ATP synthesis. Interaction of Bcl‑xL with the β‑subunit has been shown to modulate enzymatic activity. Over‑expression of Bcl‑xL increases ATP levels, whereas depletion reduces them, suggesting a regulatory role on the F₁FO complex. Bcl‑xL binds specifically to the subunits, and this interaction can be blocked by the inhibitor ABT‑737, indicating that the binding site lies within the ABT‑737 pocket of the β‑subunit. [5]
During oxidative phosphorylation, protons pumped out of the matrix re‑enter via two routes: (1) productive flux through ATP synthase and (2) non‑productive leak across the inner membrane. A reduction in the non‑productive leak improves ATP production efficiency. Experiments using oligomycin (an ATP synthase inhibitor) revealed an oligomycin‑insensitive proton leak that contributes to inefficiency. This leak can be measured by monitoring changes in membrane conductance of submitochondrial vesicles (SMVs) upon addition of ATP or ADP; both nucleotides decrease conductance. [5]
Capacities of ATP synthase can be quantified by measuring ATP production in isolated mitochondria. In pancreatic cancer cell lines (BxPC‑3 and AsPC‑1), capsaicin treatment reduced ATP synthase activity by about 75 % compared with controls, and antioxidant enzymes (catalase, EUK‑134) mitigated this decline. Western blotting confirmed decreased expression of the complex‑V protein after capsaicin exposure. [2]
Mutations in TMEM70, a protein involved in complex‑V biogenesis, are recurrently associated with ATP synthase deficiency, underscoring the importance of proper assembly for mitochondrial function. Defects in ATP synthase lead to a spectrum of mitochondrial disorders characterised by impaired energy production, neuromuscular weakness, and organ failure. [1]
DefinitionGluconeogenesis
A metabolic pathway that synthesises glucose from non‑carbohydrate precursors, primarily occurring in liver and kidney, and is essential during fasting or intense exercise.
The pathway is essentially the reverse of glycolysis but requires three enzymes that bypass the irreversible steps of glycolysis. These enzymes consume ATP (or GTP) and NADH, making gluconeogenesis energetically costly.
Pyruvate carboxylase catalyses the ATP‑dependent carboxylation of pyruvate to oxaloacetate in the mitochondrial matrix. This reaction is irreversible and provides oxaloacetate for subsequent steps. Regulation occurs at the transcriptional level (cAMP‑responsive element binding protein) and by allosteric activation with acetyl‑CoA.
PEPCK converts oxaloacetate to phosphoenolpyruvate (PEP) in the cytosol (PEPCK‑c) or mitochondria (PEPCK‑m). It uses GTP (or ATP) and is the rate‑limiting enzyme of gluconeogenesis. Hormonal regulation (cortisol, glucagon) up‑regulates PEPCK transcription, whereas insulin down‑regulates it.
Fructose‑1,6‑bisphosphatase hydrolyses fructose‑1,6‑bisphosphate to fructose‑6‑phosphate, bypassing the irreversible phosphofructokinase step of glycolysis. It is inhibited by AMP and activated by fructose‑2,6‑bisphosphate, linking it to the cell’s energetic status.
These three enzymes together ensure that gluconeogenesis can proceed even when glycolysis is blocked, allowing the liver to maintain blood glucose levels during hypoglycaemia.
A 70‑kg adult after an overnight fast has depleted glycogen stores. The liver increases expression of PEPCK and fructose‑1,6‑bisphosphatase, while insulin levels fall. Pyruvate derived from lactate and amino acids is carboxylated to oxaloacetate, then converted to PEP, and finally to glucose, which is released into the bloodstream. This process consumes approximately 6 ATP equivalents per glucose molecule produced, illustrating the high energetic cost of gluconeogenesis.
ATP synthase regulation
- Proton gradient established by ETCComplexes I–IV pump H+ into intermembrane space
- Question: Is Bcl‑xL over‑expressed?
Yes
- Bcl‑xL binds β‑subunit of F₁Enhances ATPase activity
- Reduced proton leakIncreases efficiency
No
- Normal Bcl‑xL levelsStandard ATP production
- ATP synthase catalyses ATP formationRotation of γ‑subunit drives ADP + Pi → ATP
- Question: Is oligomycin present?
Yes
- Inhibits proton flow through F₀Halts ATP synthesis
No
- Protons flow through F₀ATP synthesis proceeds
| Enzyme | Reaction | Energy requirement | Regulation |
|---|---|---|---|
| Pyruvate carboxylase | Pyruvate + CO₂ + ATP → Oxaloacetate | 1 ATP | cAMP‑CREB, acetyl‑CoA |
| PEPCK | Oxaloacetate + GTP → PEP + CO₂ | 1 GTP | Glucagon, cortisol |
| Fructose‑1,6‑bisphosphatase | Fructose‑1,6‑bisphosphate → Fructose‑6‑phosphate + Pi | 0 | AMP inhibition, fructose‑2,6‑bisphosphate |
Alcohol consumption interferes with hepatic gluconeogenesis, the principal source of endogenous glucose during fasting. Ethanol is metabolised in the liver by alcohol dehydrogenase to acetaldehyde and then by aldehyde dehydrogenase to acetate. Both reactions consume NAD⁺, producing NADH. The resulting rise in the hepatic NADH/NAD⁺ ratio shifts the redox balance, favouring the conversion of oxaloacetate to malate and pyruvate to lactate. Consequently, oxaloacetate, a key gluconeogenic precursor, is depleted, and the liver’s capacity to generate glucose is curtailed. When the liver cannot supply sufficient glucose, peripheral tissues experience a fall in blood glucose, manifesting as hypoglycaemia. This mechanism is particularly pronounced after binge drinking, when the hepatic NADH/NAD⁺ ratio can exceed 10:1, severely limiting gluconeogenic flux. [3]
DefinitionNADH/NAD⁺ ratio
The ratio of reduced to oxidised nicotinamide adenine dinucleotide in the liver; a high ratio impairs gluconeogenesis.
The Cori and alanine cycles are inter‑organ metabolic shuttles that enable the liver to utilise lactate and alanine produced in peripheral tissues for gluconeogenesis, while simultaneously removing waste products such as lactate and ammonia.
During anaerobic glycolysis in skeletal muscle and erythrocytes, pyruvate is reduced to lactate by lactate dehydrogenase. Lactate is released into the bloodstream and taken up by hepatocytes via monocarboxylate transporters. In the liver, lactate is oxidised back to pyruvate, which enters the gluconeogenic pathway, ultimately yielding glucose that is returned to the circulation for use by muscle and other tissues. This cycle is essential during intense exercise when oxygen delivery is limited. [3]
In skeletal muscle, transamination of pyruvate with glutamate by alanine aminotransferase (ALT) generates alanine and α‑ketoglutarate. Alanine is released into the bloodstream and transported to the liver. Hepatic ALT reverses the reaction, converting alanine back to pyruvate for gluconeogenesis and regenerating glutamate. Glutamate is then deaminated by glutamate dehydrogenase (GDH) to α‑ketoglutarate and ammonia, the latter entering the urea cycle to prevent ammonia toxicity. The alanine cycle thus couples carbon recycling with nitrogen disposal. [3]
The principal enzymes involved in the Cori and Alanine cycles and their physiological functions are summarised in Table 1.
| Enzyme | Tissue | Function |
|---|---|---|
| Lactate dehydrogenase | Muscle, erythrocytes | Converts pyruvate to lactate |
| Monocarboxylate transporter | Liver | Imports lactate |
| ALT (muscle) | Muscle | Forms alanine from pyruvate |
| ALT (liver) | Liver | Converts alanine to pyruvate |
| GDH | Liver | Deaminates glutamate to ammonia |
Cori and Alanine cycles
- Anaerobic glycolysisPyruvate → lactate (muscle)
- Lactate transportBlood → liver
- Lactate oxidationLactate → pyruvate (liver)
- GluconeogenesisPyruvate → glucose (liver)
- Question: Is muscle active?
Yes
- Pyruvate transaminationPyruvate + glutamate → alanine (muscle)
- Alanine transportBlood → liver
- Alanine conversionAlanine → pyruvate (liver)
- GDH activityGlutamate → α‑ketoglutarate + NH₄⁺ (liver)
No
- Assuming the liver can always compensate – In alcohol‑induced hypoglycaemia, the liver’s gluconeogenic capacity is limited by the NADH/NAD⁺ imbalance; clinicians must recognise that glucose infusion may be required.
- Overlooking the alanine cycle in nitrogen balance – Failure to recognise the alanine cycle can lead to misinterpretation of hyperammonemia in patients with liver disease.
- Misattributing lactate accumulation – Elevated lactate may stem from impaired hepatic clearance rather than solely from increased production; the Cori cycle’s efficiency must be considered.
- Neglecting the role of transporters – Monocarboxylate transporters are essential for lactate and alanine uptake; mutations or inhibition can disrupt both cycles.
- Critical care – Monitoring lactate levels guides resuscitation strategies; understanding the Cori cycle helps differentiate between increased production and impaired clearance.
- Sports medicine – Knowledge of the Cori cycle informs training regimens that optimise lactate utilisation and recovery.
- Metabolic disorders – Inborn errors affecting ALT or GDH manifest as hypoglycaemia or hyperammonemia; targeted therapies often aim to restore cycle function.
- Alcoholic liver disease – Management of hypoglycaemia requires supplementation of glucose and correction of redox imbalance.
- Alcohol consumption raises hepatic NADH/NAD⁺, impairing gluconeogenesis and causing hypoglycaemia.
- The Cori cycle recycles lactate from muscle to glucose in the liver.
- The alanine cycle shuttles carbon and nitrogen, linking gluconeogenesis with the urea cycle.
- Transporters and transaminases are critical for cycle function.
- Clinicians must recognise when these cycles are compromised in disease states.
Answer each one in your head first, then open the answer.
What metabolite is produced by lactate dehydrogenase during anaerobic glycolysis?
Show answerHide answer
lactateWhich enzyme converts alanine back to pyruvate in the liver?
Show answerHide answer
ALTWhy does alcohol consumption lead to hypoglycaemia?
Show answerHide answer
It increases the hepatic NADH/NAD⁺ ratio, limiting gluconeogenesis.What is the primary function of glutamate dehydrogenase in the alanine cycle?
Show answerHide answer
It deaminates glutamate to produce ammonia for the urea cycle.Which organ is the main site of gluconeogenesis during fasting?
Show answerHide answer
The liver.
- Signes A, Fernandez-Vizarra E. Assembly of mammalian oxidative phosphorylation complexes I-V and supercomplexes. Essays in biochemistry 2018;62(3):255-270. doi:10.1042/ebc20170098. Accessed .
- Pramanik KC, Boreddy SR, Srivastava SK. Role of mitochondrial electron transport chain complexes in capsaicin mediated oxidative stress leading to apoptosis in pancreatic cancer cells. PloS one 2011;6(5):e20151. doi:10.1371/journal.pone.0020151. Accessed .
- Akl M, Ahmed A. Metformin's disruption of gluconeogenesis in type 2 diabetes impairments of the cori and alanine cycles as hidden drivers of metabolic waste accumulation, NF-κBHIF-1α-mediated low-grade inflammation, and multisystem dysfunction. Problemy endokrinologii 2026;72(3):44-52. doi:10.14341/probl13618. Accessed .
- Gu F, Chauhan V, Kaur K, et al. Alterations in mitochondrial DNA copy number and the activities of electron transport chain complexes and pyruvate dehydrogenase in the frontal cortex from subjects with autism. Translational psychiatry 2013;3:e299. doi:10.1038/tp.2013.68. Accessed .
- Alavian KN, Li H, Collis L, et al. Bcl-xL regulates metabolic efficiency of neurons through interaction with the mitochondrial F1FO ATP synthase. Nature cell biology 2011;13(10):1224-1233. doi:10.1038/ncb2330. Accessed .
Figure credits
Educational content for medical students and doctors. It is not a substitute for clinical judgement or local guidelines.