Enzyme kinetics and inhibition
Quantitative study of catalytic rates, substrate affinities, and inhibitor interactions in clinical enzymology
Figure 1Enzyme kinetics curve
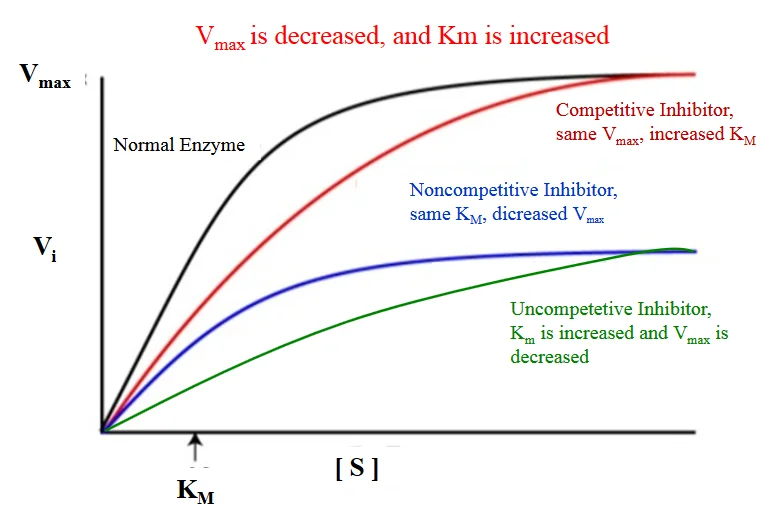
Long description
Illustration for biochemistry/enzyme kinetics and inhibition from Wikimedia Commons, titled 'Enzyme kinetics curve': enzyme inhibition curves. The author and licence are given in the credit line.

Enzyme kinetics provides the foundational mathematical framework for understanding how biological catalysts accelerate metabolic reactions and how pathological states, pharmacological agents, or toxins disrupt these pathways. From first principles, an enzyme combines reversibly with its substrate to form an enzyme-substrate complex, which then breaks down to release free enzyme and product. In clinical medicine and pharmacology, analyzing this dynamic equilibrium allows clinicians and researchers to quantify precisely how efficiently an enzyme handles its natural substrate and how severely an inhibitor impairs function.
Understanding these quantitative relationships begins with the fundamental velocity curve. When initial velocity is plotted against substrate concentration under steady-state conditions, the resulting hyperbolic curve illustrates how velocity increases with rising substrate availability until saturation is reached. Certain complex systems deviate from this standard hyperbola; for instance, values of n greater than 1 indicate positive cooperativity, such that substrate binding makes an enzyme more active toward additional substrates, and give characteristically sigmoidal v0 versus [S] plots. In a simple interpretation, an enzyme with a given Hill coefficient, n, either binds exactly n molecules of substrate or none at all. [1]
Pathological or physiological inhibition can alter these velocity profiles significantly. When binding a molecule of substrate at an allosteric site reduces enzyme activity toward additional substrates, which is known as substrate inhibition, enzyme velocity can often be described by specialized mathematical expressions. Modern biophysical assays, such as isothermal titration calorimetry, can characterize these complex mechanisms directly; for example, researchers used isothermal titration calorimetry to fully characterize the complex kinetic mechanism of gluconokinase, which transfers a phosphate from ATP to the common nutrient gluconate. These experimental approaches show that shapes of the plots can vary as a function of ATP concentration in a way that was consistent with substrate inhibition occurring via the formation of an enzyme, ADP, and gluconate ternary complex. [1]
DefinitionEnzyme Kinetics
The quantitative measurement of the rates of enzyme-catalysed reactions and the systematic study of factors affecting these rates.
Clinical assays frequently measure inhibitory potency using standardized concentration thresholds. For example, the concentration of peptide that inhibited ACE activity by 50 percent, termed the IC50, was calculated by non-linear regression from a plot of percentage angiotensin-converting enzyme inhibition versus four peptide concentrations of 0.125, 0.25, 0.5, and 1.0 milligrams per millilitre. Investigating enzyme mechanisms often requires careful selection of substrate ranges; the kinetics of angiotensin-converting enzyme inhibition was studied with substrate concentrations spanning 0.0625, 0.125, 0.25, and 0.5 millimoles per litre of FAPGG. [2] [1]
Clinical pearlClinical Relevance of Inhibition
Determining whether an inhibitor is competitive, non-competitive, or mixed helps predict whether high local substrate concentrations can overcome pharmacological blockade in human tissues.
Assay design must account for feedback loops and product accumulation. A similar type of situation occurs when the enzyme is inhibited by the reaction product. In this case, the product of the reaction accumulates after each injection, leading to progressively slower catalysis. In fact, slowing catalysis with subsequent injections in a single injection isothermal titration calorimetry experiment is a hallmark of product inhibition. A challenge can arise when inhibition is strong, since the product generated by a single injection can be sufficient to essentially abrogate activity of the enzyme in subsequent injections. This was the case in studies of several bacterial kinases and their inhibition by the reaction product ADP. Interestingly, ADP inhibition of kinases cannot be studied using the standard coupled enzyme assay for kinase activity, since ADP is reconverted to ATP by the secondary enzymes. [1]
| Parameter | Definition | Experimental Context |
|---|---|---|
| Km | Substrate concentration at half-maximal velocity | Derived from non-linear regression or Lineweaver-Burk plots |
| Vmax | Maximal theoretical catalytic velocity | Asymptotic upper limit of the velocity curve |
| IC50 | Inhibitor concentration causing 50 percent activity loss | Calculated across multiple inhibitory dilutions |
| Hill Coefficient (n) | Measure of cooperative substrate binding | Values above 1 denote positive cooperativity |
To extract precise numerical values from raw experimental data, kineticists transform hyperbolic Michaelis-Menten curves into linear representations, most notably the Lineweaver-Burk double-reciprocal plot. From first principles, taking the reciprocal of the Michaelis-Menten equation yields an equation of a straight line, where the y-intercept represents the reciprocal of maximum velocity and the x-intercept represents the negative reciprocal of the Michaelis constant. This linearization technique historically allowed researchers to determine enzyme parameters graphically before the widespread availability of advanced non-linear regression software.
In diagnostic and pharmacological investigations, these plots reveal the precise mechanism by which various compounds modify enzymatic activity. For instance, the mode of angiotensin-converting enzyme inhibition was determined from the Lineweaver-Burk plots while kinetic parameters including Vmax and Km were estimated from non-linear regression fit of the data to the Michaelis-Menten equation using specialized statistical software. Different classes of inhibitors produce distinct geometric shifts in these double-reciprocal plots, allowing clinicians and pharmacologists to distinguish competitive inhibition from non-competitive and uncompetitive mechanisms. [1] [2]
Enzyme Inhibition Analysis Workflow
- Measure initial velocities across varied substrate concentrationsGenerate baseline v0 vs [S] data.
- Question: Does inhibitor alter Vmax without changing apparent Km?
Yes
- Classify as non-competitive inhibitionLines intersect at the x-axis.
No
- Evaluate intercept shifts for competitive or mixed inhibitionExamine double-reciprocal intersections.
When studying alternative enzyme systems, graphical signatures provide immediate diagnostic clues. Illustrative worked example: if a novel drug candidate increases the slope of a Lineweaver-Burk plot without altering the y-intercept, it demonstrates pure competitive inhibition where high substrate concentrations can completely overcome the blockade. Conversely, graphical analyses of renin inhibition demonstrate distinct topological features. In contrast to angiotensin-converting enzyme inhibition kinetics, certain peptide fractions exhibited a non-competitive mode of renin inhibition because the lines intersect the x-axis at approximately the same point. Non-competitive renin inhibition is typically exhibited with observed decreases in maximum velocity but with similar Michaelis constant values. [2]
Furthermore, the physical and dynamic properties of the assay system influence these plots. Advanced biophysical techniques such as isothermal titration calorimetry overcome traditional methodological drawbacks. These drawbacks can be overcome with calorimetry-based enzyme kinetic experiments, which require far less enzyme than binding experiments. In a binding experiment, a single molecule of enzyme generates heat only once, when it forms a complex with the inhibitor, whereas in a kinetics experiment, a single molecule of enzyme produces heat continuously as it undergoes multiple turnover. This allows these kinetic experiments to routinely be performed with sub-nanomolar protein concentrations, which is outside the typical concentration range of calorimetry binding experiments. [1]
Exam trapLineweaver-Burk Weighting Errors
Double-reciprocal transformations disproportionately weight points measured at low substrate concentrations, potentially skewing calculated kinetic constants if experimental error at those low points is high.
Advanced instrumental configurations can detect subtle phenomena that standard optical assays miss. An additional interesting feature of calorimetry data is the slow and gradual increase in enzyme velocity after the first injection, where the steady-state rate of catalysis was not reached until roughly 15 minutes after the enzyme was added. Researchers attribute this lag to the opening of crystalline regions on the colloid surface to expose new fibril ends that are susceptible to the enzyme. This study vividly illustrates how modern thermal data can give information not only on enzyme kinetics, but also on the dynamic processes to which the enzyme activity is linked. [1] [2]
The Michaelis constant, denoted as Km, and the maximal velocity, denoted as Vmax, represent the two cornerstone parameters of quantitative enzymology. From first principles, Km reflects the substrate concentration at which the reaction velocity is exactly half of its maximal limit. Mechanistically, Km incorporates the rate constants for both the formation and breakdown of the enzyme-substrate complex, serving as an inverse measure of an enzyme's affinity for its substrate. A lower Km indicates tighter binding and higher apparent affinity, meaning the enzyme achieves half-maximal efficiency at modest substrate availability. Conversely, Vmax represents the theoretical upper limit of reaction velocity under saturating substrate conditions, directly proportional to the total enzyme concentration and the catalytic rate constant of the single enzyme species.
In clinical diagnostics and pharmacology, these parameters help characterize mutant enzymes associated with inherited metabolic disorders or assess the potency of therapeutic enzyme replacements. For example, kinetic parameters including Vmax and Km were estimated from non-linear regression fit of the data to the Michaelis-Menten equation using software packages such as GraphPad Prism. When investigating inhibitory mechanisms, alterations in these parameters provide definitive classification. Non-competitive renin inhibition is typically exhibited with observed decreases in maximum velocity but with similar Michaelis constant values. Moreover, the enzyme concentration and inhibition constant of the renin enzyme both decreased dose-dependently, suggesting that as the inhibitor concentration was increased, the inhibitor binding affinity and inhibition efficiency for the enzyme increased, resulting in a reduction in enzyme activity due to conformational changes. [2]
DefinitionMichaelis Constant (Km)
The substrate concentration required for an enzyme to reach half of its maximal velocity.
Experimental determination of Km and Vmax requires precise control over assay conditions, including temperature, pH, and ionic strength. Traditional concentration-based enzyme assays detect gradual decreases and increases in enzyme velocity as slight curvature in the product buildup curve, making quantitative analysis far more difficult. In contrast, advanced thermal methods exploit the fact that calorimetry measures enzyme velocity directly. Data for a series of injections can be fitted simultaneously to yield dissociation rates and inhibition constants. The association rate can then be calculated, and note that concentrations of enzyme are so low in these experiments, approximately 10 nanomolar, that the instrument detects only heats of catalysis, while heats of inhibitor and enzyme binding can be safely ignored. [1]
Clinical pearlVmax and Enzyme Concentration
Unlike Km, which is an intrinsic constant independent of enzyme concentration, Vmax scales directly with the total amount of active enzyme present in the clinical sample.
Comprehending how polyphenols and other biological modulators alter these parameters is essential for nutritional science and pharmacology. All of the polyphenols affected both the catalytic constant of the enzyme, indicated by the height of the asymptote, and the Michaelis constant, indicating mixed modes of inhibition, although the curves were not fitted quantitatively in this study. Mixed inhibition was also observed using experiments with a colorimetric assay detected by ultraviolet-visible spectroscopy. The enzyme injection technique allowed researchers to initiate the reaction with very small additions of dilute reagent, specifically 1 microlitre of 1 micromolar enzyme, thereby almost entirely avoiding injection artifacts. Each experiment consists of a single peak, corresponding to the complete conversion of substrate to product over the course of about 2.5 hours, illustrating the remarkable precision achievable in modern clinical enzymology research. [1]
Enzyme inhibition is a foundational concept in pharmacology and therapeutics, describing how small molecules or biological agents reduce the catalytic rate of enzymes. A quantitative analysis of enzyme inhibition typically involves determination of the mode and the inhibitor dissociation constant Ki. For mixed-mode inhibitors, there are separate Ki values for binding to the free enzyme and to the enzyme-substrate complex. Apparent Km and kcat values are measured at different concentrations of inhibitor and analyzed collectively to extract the inhibition parameters. Understanding these kinetic profiles helps explain mechanisms of drug action, resistance patterns, and metabolic control. [1]
In competitive inhibition, the inhibitor binds exclusively to the free enzyme. Because the inhibitor and the normal substrate compete for the same active site, a high concentration of substrate can outcompete the inhibitor, meaning that the maximum velocity can still be reached. On a double-reciprocal plot, the data give a series of straight lines that intersect at the y-axis, which is consistent with a competitive inhibition mechanism. A classic clinical example of competitive inhibition involves statins, which act as competitive inhibitors of HMG-CoA reductase by resembling the natural substrate, thereby lowering cholesterol synthesis. Another example is methotrexate, which competitively inhibits dihydrofolate reductase in rapidly dividing cells. [1]
In uncompetitive inhibition, the inhibitor binds exclusively to the enzyme-substrate Michaelis complex and not to the free enzyme. Because the inhibitor only binds after the substrate has already formed a complex with the enzyme, increasing the substrate concentration does not overcome the inhibition. For uncompetitive inhibition patterns, double-reciprocal plots show lines that cross each of the y- and x-axis at different points, and both apparent Michaelis constant and maximum velocity values
In non-competitive inhibition, the inhibitor can achieve its inhibitory effects by binding to both the free enzyme and the enzyme-substrate complex, reducing enzyme affinity for substrate and leading to decreased maximum velocity values. This mechanism is different from the uncompetitive and mixed-type modes reported for flaxseed cationic and hemp seed protein hydrolysate peptides respectively. While traditional binding assays like isothermal titration calorimetry have specific limitations—such as uncompetitive inhibitors showing no interaction at all in traditional experiments because they bind exclusively to the enzyme-substrate complex—advanced kinetic methods allow full characterization. For instance, studies on renin inhibition by cod peptides obtained demonstrate a non-competitive mode of action. [1] [2]
DefinitionInhibition Modes
| Inhibition Mode | Binding Site Target | Effect on Maximum Velocity | Effect on Michaelis Constant |
|---|---|---|---|
| Competitive | Free enzyme active site | Unchanged | Increased |
| Uncompetitive | Enzyme-substrate complex | Decreased | Decreased |
| Non-competitive | Free enzyme and complex | Decreased | Unchanged |
Identifying Inhibition Modes
- Perform kinetic assays at varying inhibitor concentrationsMeasure reaction rates across substrate gradients.
- Question: Do double-reciprocal plot lines intersect on the y-axis?
Yes
- Competitive inhibitionKm increases, Vmax unchanged.
No
- Question: Do lines intersect to the left of the y-axis or remain parallel?
Parallel or crossing x-axis
- Uncompetitive or non-competitive inhibitionVmax decreases.
Mixed intersections
- Mixed-mode inhibitionSeparate Ki for free enzyme and complex.
Allostery is a key feature of biological systems in which covalent modification or ligand binding at one site influences the activity at distant sites in a macromolecule or macromolecular assembly. Allosteric regulation plays a central role in metabolism and cell signaling and has been identified as a source of new drug targets, meaning that detailed descriptions of allostery have far-reaching implications. For example, the downstream products of a biosynthetic pathway can down-regulate the activity of the enzyme catalyzing the first committed step, maintaining balance between different branches of core metabolism through the process of feedback inhibition. Alternatively, enzymes may require allosteric activators in order to function, providing an extra layer of control. [1]
In the special case that the substrate itself acts as an allosteric effector, enzyme kinetics necessarily deviate from the classical Michaelis-Menten model. This can often be accounted for mathematically with a Hill coefficient of cooperativity, n, such that the enzyme velocity is given by standard cooperative expressions. Advanced biophysical techniques such as isothermal titration calorimetry allow detailed characterization of these systems. For example, researchers investigating prolyl-oligopeptidase, a validated drug target for multiple myeloma, used single injection assays to study native peptide substrates rather than chemically modified colorigenic analogs. They found that at lower enzyme concentrations, data were well fit by standard equations, while at higher concentrations, cooperativity became more apparent, with n greater than 2 at an enzyme concentration of 2 micromolar. At the high enzyme concentrations where this behavior becomes apparent, reactions go to completion in 10 seconds or less, underlining the potential of modern biophysical methods to characterize rapid reaction kinetics. [1]
The surrounding milieu can also profoundly influence enzyme activity and allosteric dynamics. Isothermal titration calorimetry serves as a powerful probe of complex dynamics, including experiments performed on suspensions of living cells. Comparing the behavior of enzymes in vitro and in situ is critical for understanding how they work in living systems and can reveal how enzyme kinetics are tied to additional layers of biological dynamics. Furthermore, studying enzymes in the intact organism avoids the question of whether activity has been compromised by extraction and circumvents the need for purification steps at all. For instance, investigators used these techniques to study the metallo-beta-lactamase NDM-1 in living cultures of Escherichia coli. NDM-1 cleaves carbapenems, providing bacterial resistance to these last resort beta-lactam antibiotics. These live-cell and complex milieu applications highlight how allosteric and kinetic parameters observed in isolation can be modulated within intact cellular environments. [1]
Clinical pearlCooperativity
| Regulatory Feature | Mechanism | Biological Significance |
|---|---|---|
| Feedback Inhibition | Downstream product inhibits first committed step | Prevents metabolite overproduction |
| Allosteric Activation | Effector binding stimulates distant catalytic sites | Enables conditional enzyme activation |
| Positive Cooperativity | Substrate binding enhances subsequent binding | Generates sigmoidal response curves |
Analyzing Allosteric and Cooperative Kinetics
- Measure initial reaction rates across substrate concentrationsExamine velocity curves for deviation from standard Michaelis-Menten kinetics.
- Question: Does the saturation curve exhibit a sigmoidal shape?
Yes
- Calculate Hill coefficientDetermine if n is greater than 2 indicating cooperativity.
No
- Standard hyperbolic kineticsProceed with standard Michaelis-Menten analysis.
Enzyme kinetics provides the fundamental mathematical framework for understanding how biological catalysts accelerate chemical reactions and how their activity is modulated in living systems. To appreciate these concepts from first principles, one must examine how enzymes interact with multiple substrates or effectors, particularly when standard hyperbolic kinetics gives way to sigmoidal behaviour. In many multi-subunit enzymes, the binding of a substrate molecule to one active site alters the affinity of remaining unoccupied sites for subsequent substrate molecules. This phenomenon is known as cooperativity. Positive cooperativity enhances the binding of subsequent substrate molecules, producing a sigmoidal velocity versus substrate concentration curve rather than a simple rectangular hyperbola.
A classic illustration of this regulatory mechanism involves the enzyme phenylalanine hydroxylase. When investigators measure standard Michaelis-Menten or Briggs-Haldane curves in the absence of phenylalanine, the resulting plot follows a standard hyperbolic trajectory. However, in the presence of 6 mM phenylalanine, the kinetic curve shifts markedly to the right, reflecting a lower substrate affinity, and simultaneously develops a distinct sigmoidal character, which serves as a classical hallmark of positive cooperativity. Interestingly, the addition of the osmolyte proline is capable of shifting this modified curve back to its original location, effectively corresponding to a return of the inactive structural state to the active conformational state. [1]
DefinitionPositive Cooperativity
Positive cooperativity occurs when substrate binding at one active site increases the affinity of other active sites, generating a sigmoidal rate curve.
To quantify and analyse these kinetic and thermodynamic parameters experimentally, modern biophysical techniques such as Isothermal Titration Calorimetry (ITC) are frequently employed. The raw output of an ITC instrument measures feedback power as a function of time, typically recorded at 1 second intervals. When characterizing binding or reaction thermodynamics, the deflection of the ITC signal from the baseline is integrated over the entire injection to extract enthalpy differences between unreacted and reacted states, distinguishing free versus bound species or substrates versus products. When characterizing kinetics instead, the instantaneous output power is interpreted directly in terms of reaction velocity, because the rate of heat production or absorption in the sample cell is directly proportional to the rate of the reaction. [1]
Experimentally, researchers design assays to measure initial velocity as a function of substrate concentration so that enzyme kinetic parameters can be extracted. Historically termed pseudo-first order and continuous assays, these are more commonly designated in modern practice as multiple injection and single injection assays respectively. Multiple injection assays offer the distinct advantage of accommodating substantially lower enzyme concentrations. For example, in systems where saturation is reached at about 4.5 mM substrate with a maximum velocity of 40 nM s-1, completing a single injection assay would require more than 105 seconds, or 28 hours, for the enzyme to convert a sufficient quantity of substrate to product, a timeframe that is entirely impractical for routine laboratory work. Nevertheless, multiple injection assays require the enthalpy of the reaction to be determined in a separate measurement, whereas single injection data yields it directly. [1]
Executing precise enzyme kinetics measurements requires careful attention to experimental design to avoid major technical artefacts. One major pitfall arises when experiments are conducted at temperatures approaching the thermal melting point of the protein. Placing the enzyme inside the injection syringe, which rests at ambient temperature, allows the protein to spend as little time as possible exposed to high and potentially destabilizing temperatures. However, loading the enzyme into the syringe introduces a major operational limitation: recurrent single injection assays become impossible because the maximum concentration of substrate must be present at the outset in the sample cell and cannot be replenished once conversion to product reaches completion. [1]
A further hazard associated with syringe configurations is mechanical leakage. Small amounts of material can inadvertently leak from the tip of the injection syringe during the long initial equilibration step, as well as during shorter delays between individual injections. While minor leakage is a general concern, it is potentially far more serious when the enzyme itself is housed in the syringe. Uncontrolled leakage of enzyme can act upon the substrate residing in the sample cell throughout the entire pre-experiment equilibration period, consuming much or all of the substrate before the formal measurement has even begun. Conversely, the accidental leakage of a few microlitres of substrate from the syringe tip does not dramatically imperil the procedure. To prevent premature substrate depletion, it is strongly recommended to employ a buffer plug when injecting enzyme, which involves drawing a few microlitres of plain buffer into the needle after loading the enzyme solution. [1]
Exam trapEnzyme Leakage
Placing enzymes in the injection syringe risks premature substrate consumption via leakage during equilibration; always use a protective buffer plug.
Time scale matching represents another critical consideration when interpreting kinetic data. The instrument response time varies according to the manufacturer, specific model, temperature, solution viscosity, and stirring speed. This instrumental response must be measured empirically using very short calibration injections, such as calcium ions into EDTA, performed under conditions as close as possible to the experimental setup of interest. This rigorous deconvolution approach is only strictly necessary when measuring rapid reactions that occur on the same timescale as the instrument response, which is roughly less than 20 to 30 seconds. For slow reactions that take tens of minutes or longer to complete, the instrument response can be largely ignored. For intermediate timescale reactions, approximating the system with a single instrument response time tau is generally adequate. [1]
ITC Kinetic Assay Design
- Select Assay TypeChoose between single and multiple injection based on enzyme stability and velocity.
- Question: Enzyme in syringe?
Yes
- Load buffer plugDraw a few uL of buffer into the needle to prevent premature substrate leakage.
- Run single injectionMeasure enthalpy and velocity directly from the single rapid conversion peak.
No
- Determine dRH separatelyMeasure reaction enthalpy independently as required for multiple injection protocols.
- Perform titration seriesInject sequential aliquots of substrate into the sample cell containing enzyme.
Enzyme kinetics principles and biophysical assays have direct translational applications in pharmacology, particularly in the evaluation and characterization of therapeutic inhibitory agents. Understanding inhibitory kinetic properties is vital because it helps reveal the precise mechanisms by which various molecules, including bioactive peptides, are able to act as effective antihypertensive agents[1]. For instance, the inhibition of angiotensin-converting enzyme by specific peptides such as CPH and CF3 occurs through an uncompetitive inhibitory mode[1]. This uncompetitive mechanism means that the inhibitory peptides bind exclusively to the pre-formed enzyme-substrate complex, generating non-productive inhibitory complexes that exhibit a reduced capacity to yield final reaction products[1]. [2]
Clinical pearlUncompetitive Inhibition
Uncompetitive inhibitors bind only to the enzyme-substrate complex, reducing catalytic activity and lowering maximum velocity proportionally.
As demonstrated in detailed kinetic analyses, the binding of CPH and CF3 to angiotensin-converting enzyme leads to a direct reduction in catalytic activity[1]. This functional inhibition is manifested experimentally as a decrease in maximum velocity that occurs in direct proportion to the escalating concentration of the peptide inhibitor[1]. Furthermore, this decreased catalytic activity and overall catalytic efficiency observed in the presence of these peptide inhibitors can be attributed to enzyme conformational rearrangements[1]. These conformational shifts physically reduce the ability of the active site to accommodate and process the substrate efficiently[1]. [2]
| Assay Feature | Multiple Injection Assay | Single Injection Assay |
|---|---|---|
| Enzyme Concentration | Accommodates substantially lower concentrations | Requires higher concentrations for rapid conversion |
| Enthalpy Determination | Must be determined in a separate measurement | Obtained directly from single injection data |
| Assay Duration | Suitable for slow reactions requiring extended time | Limited by complete substrate exhaustion |
| Primary Limitation | Requires separate enthalpy calibration | Prone to baseline drift over long durations |
- Positive cooperativity produces a sigmoidal velocity curve reflecting shifting subunit affinity.
- Isothermal Titration Calorimetry measures instantaneous heat production proportional to reaction velocity.
- Single injection assays yield reaction enthalpy directly but consume significant enzyme.
- Multiple injection assays accommodate lower enzyme concentrations but require separate enthalpy calibration.
- Enzyme in the injection syringe risks premature substrate depletion through leakage during equilibration.
- Buffer plugs should be drawn into the needle to prevent premature enzyme leakage.
- Uncompetitive inhibitors bind the enzyme-substrate complex, decreasing maximum velocity proportionally.
Answer each one in your head first, then open the answer.
What kinetic curve shape is produced by positive cooperativity?
Show answerHide answer
sigmoidalWhat instrument measures heat production proportional to reaction velocity?
Show answerHide answer
isothermal titration calorimetryWhat type of assay requires enthalpy to be determined in a separate measurement?
Show answerHide answer
multiple injection assayWhat protective measure prevents enzyme leakage from the syringe needle?
Show answerHide answer
buffer plugWhat inhibitory mode involves binding exclusively to the enzyme-substrate complex?
Show answerHide answer
uncompetitive
- Wang Y, Wang G, Moitessier N, Mittermaier AK. Enzyme Kinetics by Isothermal Titration Calorimetry: Allostery, Inhibition, and Dynamics. Frontiers in molecular biosciences 2020;7:583826. doi:10.3389/fmolb.2020.583826. Accessed .
- Girgih AT, Nwachukwu ID, Hasan F, et al. Kinetics of the inhibition of renin and angiotensin I-converting enzyme by cod (Gadus morhua) protein hydrolysates and their antihypertensive effects in spontaneously hypertensive rats. Food & nutrition research 2015;59:29788. doi:10.3402/fnr.v59.29788. Accessed .
Figure credits
Educational content for medical students and doctors. It is not a substitute for clinical judgement or local guidelines.