Pulmonary function tests
How lung volumes, airflow, gas transfer and blood gases are measured and what their patterns mean.
- Pulmonary function tests (PFTs) measure how much air the lungs can hold, how quickly it can be moved, how well gas crosses into the blood, and (with an arterial blood gas) the patient's acid-base status. [3]
- Spirometry is the core test. The three numbers that do most of the work are the forced vital capacity (FVC), the forced expiratory volume in one second (FEV1), and the FEV1/FVC ratio. [1][9]
- A reduced FEV1/FVC ratio defines obstruction; reduced volumes with a preserved ratio raise the possibility of restriction, which only lung-volume measurement can confirm. [9]
- Results are compared with prediction equations, and the lower limit of normal is conventionally the fifth percentile, not 80% of the predicted value and not a fixed ratio. [1][2]
- Those equations have historically been race-specific; current guidance favours race-neutral interpretation using the GLI Global average equations. [2][10]
- A bronchodilator reversibility test, a DLCO test, an arterial blood gas or bronchial provocation testing is added when the clinical question requires it. [1][3][7]
By the end of this page you should be able to:
- Name the four lung volumes and four capacities and explain how each is measured. [3][6]
- Perform and quality-check a spirometry test, including repeatability criteria. [1]
- Read FEV1, FVC and FEV1/FVC using the lower limit of normal and the fixed 0.7 ratio, and explain when each is used. [1][2][4]
- Recognise obstructive and restrictive patterns, list their common causes, and say what lung-volume measurement adds. [3][9]
- State the bronchodilator responsiveness threshold and how a reversibility test is done. [5]
- Explain each flow-volume loop shape and what it implies. [3]
- Interpret a raised or lowered DLCO and know its common causes. [3]
- Carry out the step-by-step interpretation of a full PFT set, including an arterial blood gas, and adapt testing to low-resource settings. [8][9]
Pulmonary function tests (PFTs) are a group of tests, most of them breathing tests, that answer four questions: how big the lungs are, how fast air can be moved, how well gas crosses from alveolus to blood, and what the arterial blood chemistry is. [3][8] The commonest test by far is spirometry, followed (when needed) by lung-volume measurement, a transfer-factor (DLCO) test, bronchodilator or provocation testing, and an arterial blood gas. [1][3]
They are usually requested to evaluate cough, wheeze, breathlessness, or chest tightness; to tell obstruction from restriction; to monitor chronic lung disease; to assess pre-operative risk; to detect occupation-related change; and to track the effect of treatment. [3][9]
As a procedure, forceful spirometry needs a cooperative patient and a trained operator. The patient exhales as hard and as completely as possible, so there are a few precautions. Testing is usually deferred or modified after a recent myocardial infarction, unstable angina, a stroke or an aneurysm that could rupture, a pneumothorax, frank haemoptysis, or recent eye, thoracic or abdominal surgery, and in any patient who cannot follow instructions or hold the mouthpiece. [3] Consent is implied by cooperation; the patient should be told in advance to withhold bronchodilators before a planned reversibility test (see below) and reminded of this on the day. [1]
Equipment is a calibrated spirometer (or complete PFT system) with disposable mouthpieces and a nose clip; a calibrated 3-litre syringe; a bronchodilator and spacer for reversibility testing; and full resuscitation equipment when bronchial challenge is performed. [1][3] The basic steps are: check and calibrate the device, show the patient what is required, have them sit or stand with a nose clip in place, ask for a maximal inspiration, then a rapid, forceful, complete exhalation, followed by quiet breathing and repetition. [1][3]
Figure 1Lungvolumes
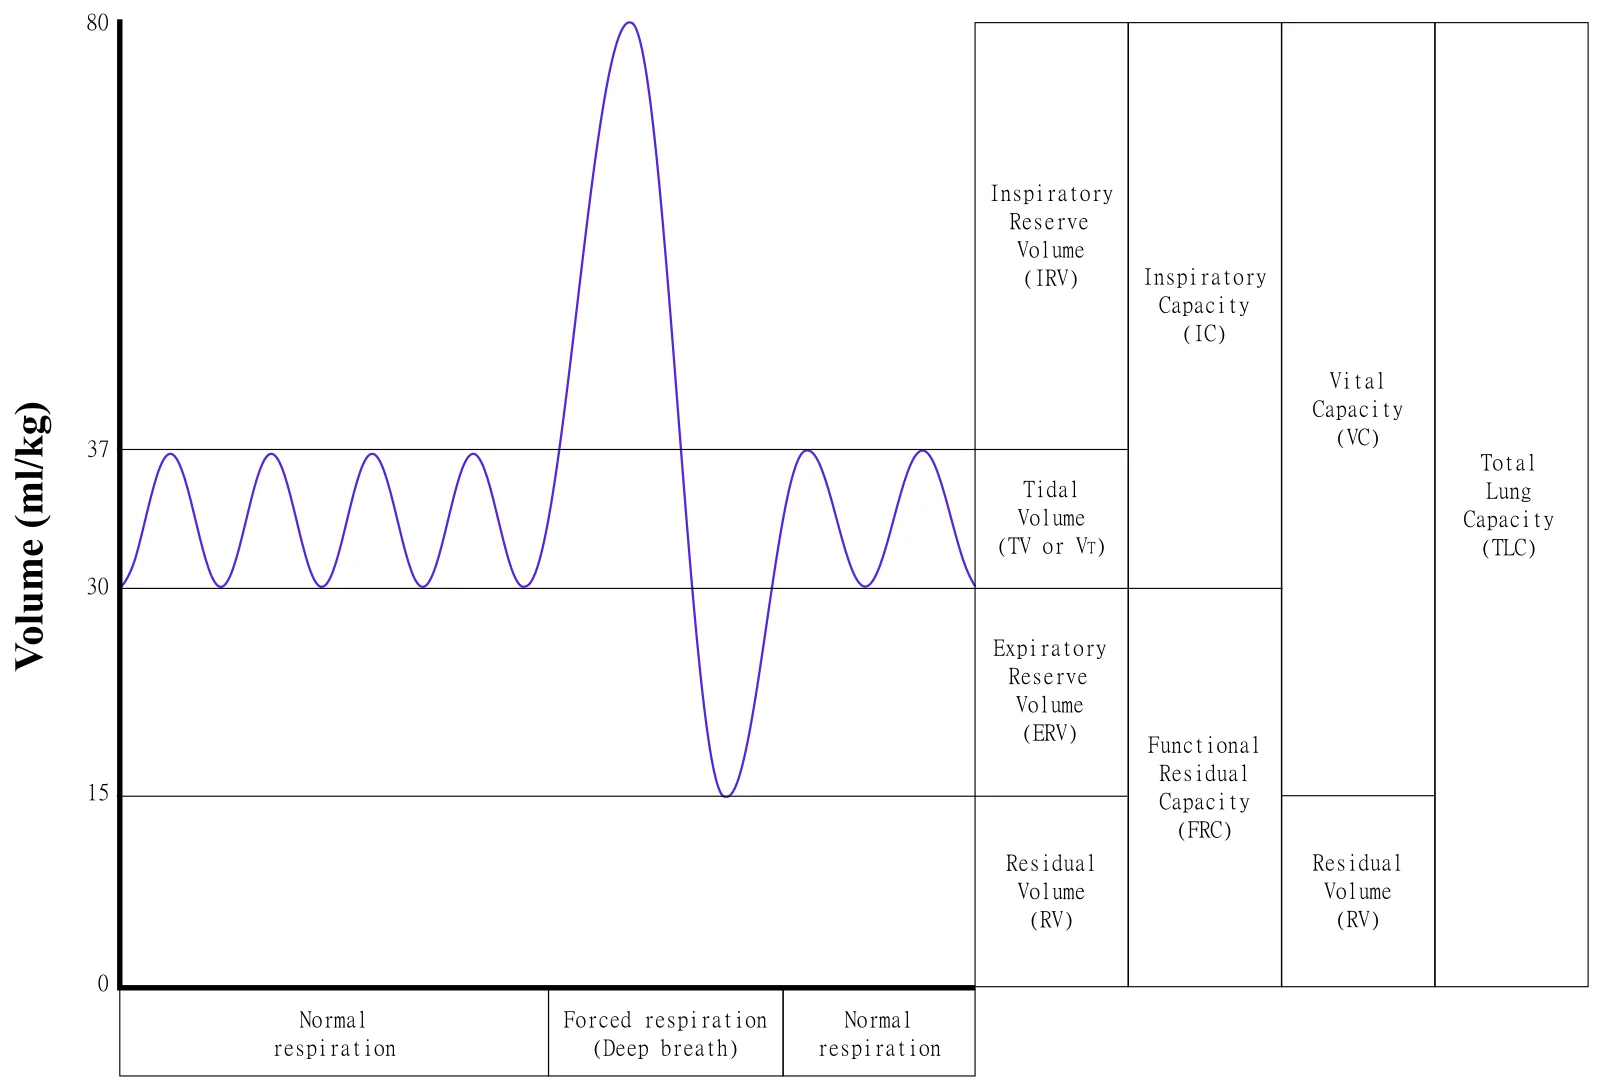
Long description
A schematic graph of a typical spirometer output for a normal person taking four tidal breaths followed by maximal inspiration and expiration, with corresponding volumes and capacities noted in the right-hand boxes.

Figure 2Volúmenes pulmonares estáticos
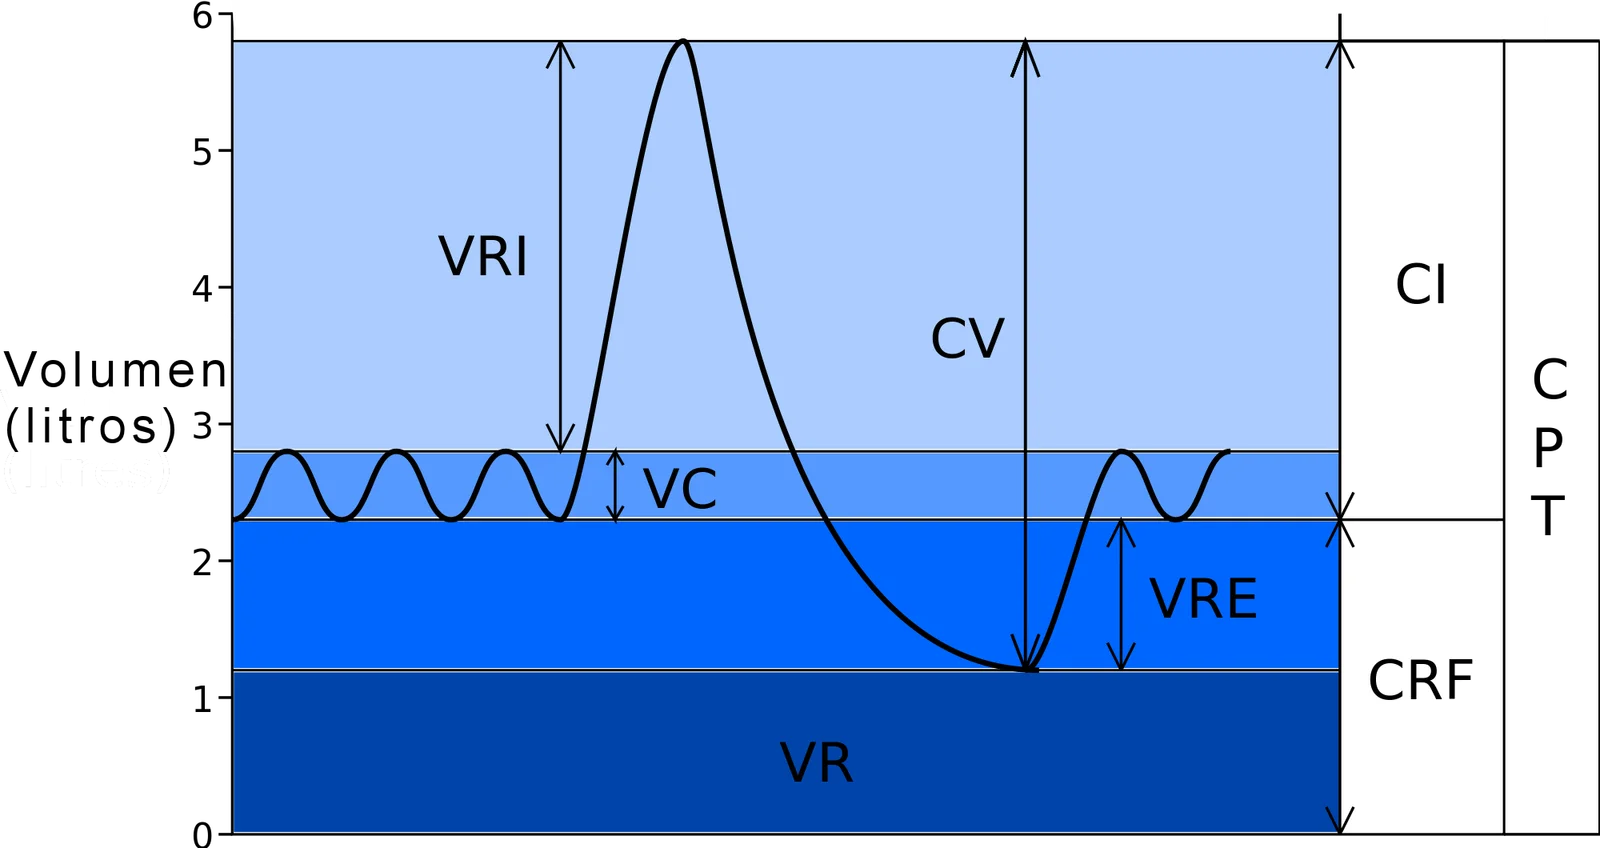
Long description
A Spanish-labelled diagram of human static lung volumes and capacities whose description lists CI, CPT, CRF and CV among the volumes and capacities.

The lung is divided into four non-overlapping volumes and four capacities, each of which is the sum of two or more volumes. [3] The normal values below are rounded adult teaching values; every laboratory uses prediction equations graded for age, sex, height and ethnicity. [6]
| Quantity | Definition | How it is measured | Typical adult value |
|---|---|---|---|
| Tidal volume (TV) | Gas inhaled or exhaled in one quiet breath. | Spirometry | about 0.5 L (500 mL) [6] |
| Inspiratory reserve volume (IRV) | Extra gas that can be inspired from the top of a normal breath. | Spirometry (as part of vital capacity) | not a fixed number; forms most of the inspiratory capacity |
| Expiratory reserve volume (ERV) | Extra gas that can be exhaled after a normal breath out. | Spirometry | up to about 1.2 L in men [6] |
| Residual volume (RV) | Gas left after a maximal exhalation. | Cannot be exhaled; measured by body plethysmography, helium dilution or nitrogen washout. | Not exhaled; derived as TLC minus VC (typically about one fifth of TLC in health) |
| Functional residual capacity (FRC) | Gas left at the end of a normal breath out (ERV + RV). | Body plethysmography or gas dilution | defined by measurement: ERV + RV |
| Vital capacity (VC) | Maximal gas exhaled slowly or forcefully after maximal inspiration. | Spirometry | 4.0 to 5.0 L [6] |
| Total lung capacity (TLC) | Gas in the lungs after a maximal inspiration (VC + RV). | FRC + IC, or VC + RV | about 6.0 L in men and 4.2 L in women [6] |
Why RV, and therefore FRC and TLC, cannot come from spirometry deserves emphasis: spirometry only measures the air that moves. The air that stays behind has to be measured indirectly. [3] Three methods are used:
- Body (whole-body) plethysmography. The patient sits in an airtight cabin and pants against a closed shutter. By Boyle's law, the change in box pressure gives the volume of compressible gas in the chest at FRC, from which other volumes are calculated. [3]
- Helium dilution. A known volume of helium is added to a closed breathing circuit; because helium is inert and insoluble, its dilution gives the FRC. [3]
- Nitrogen washout. The patient breathes 100% oxygen and the washed-out nitrogen is measured to calculate FRC. [3]
Plain radiographic and CT methods can also estimate TLC, and they are sometimes used when gas-dilution underestimates volume in severe airway obstruction. [3]
Spirometry is the single most useful pulmonary function test. [1] A forced manoeuvre asks the patient to take a maximal breath in and then blast the air out as hard and as completely as possible while the machine records flow against time or volume. [1][3]
- Explain and demonstrate the manoeuvre; the patient must understand that force and completeness matter, and that the effort must be sustained, not a quick puff. [1]
- Calibrate and check the device (a 3-litre syringe cycled at least three times on the day of testing) and keep the unit at ambient conditions; all results are reported at BTPS. [1]
- Position the patient seated or standing with a nose clip; the mouthpiece must be sealed by the lips with no leak. [1][3]
- Ask for maximal inspiration, then immediate forced expiration to residual volume; the trace is continued to the end of the plateau or until no more air moves. [1]
- Repeat until at least three acceptable manoeuvres are obtained, with rest between them so that the patient and operator agree the next will be maximal. [1]
Acceptability and repeatability are what separate a result from a guess. In adults (over 6 years of age) the difference between the two largest FVC values must be 0.150 L or less, and the difference between the two largest FEV1 values must be 0.150 L or less. [1] In children 6 years and under the limit is 0.100 L or 10% of the highest value, whichever is greater. [1] Each manoeuvre must also show a rapid, full onset (back-extrapolated volume under 5% of FVC or 0.100 L, whichever is greater), no cough or leak, and a satisfactory end-expiratory plateau. [1] The highest values do not simply win: the curve with the largest sum of FEV1 and FVC is reported, so that one excellent-appearing but non-reproducible blow does not dominate. [1] Spirometry quality is graded, and grade A needs three acceptable, repeatable manoeuvres; lower grades can still be usable but need careful clinical judgement. [1]
A spirometer can be fooled by poor effort, so coaching is part of the test. The standard also warns against an old shortcut: using 80% of the predicted FEV1 or FVC as the cut-off for "normal". There is no statistical basis for it, and it misclassifies more than one in five patients; the lower limit of normal based on the fifth percentile should be used instead. [3]
A planned bronchodilator responsiveness test is only informative if the patient arrives with the airways in their baseline state. [1] Typical withholding times are:
| Drug | Withhold for |
|---|---|
| Short-acting beta-2 agonist (salbutamol/albuterol) | 4 to 6 h [1] |
| Short-acting muscarinic antagonist (ipratropium) | 12 h [1] |
| Long-acting beta-2 agonist (salmeterol, formoterol) | 24 h [1] |
| Ultra-long-acting beta-2 agonist | 36 h [1] |
| Long-acting muscarinic antagonist | 36 to 48 h [1] |
Inhaled corticosteroids and leukotriene modifiers do not need to be withheld, and if the test is being done to see whether spirometry can be improved on current treatment, the patient's regular medication may be continued. [1] When the test is used for diagnosis, all bronchodilators are withheld and the baseline test reflects untreated airway function. [1]
- FVC is the total volume of air that can be blown out forcefully after a full breath in. [1][9]
- FEV1 is the volume blown out in the first second of that manoeuvre. [1][9]
- FEV1/FVC is the fraction of the vital capacity that can be exhaled in one second. [1][9]
Obstruction is a disproportionate slowing of emptying: FEV1 falls more than FVC and the ratio falls. Restriction is a loss of volume: FVC (and FEV1) fall, but the ratio is preserved, because the lung empties quickly; a low ratio in an apparently restrictive pattern raises a mixed picture. [9]
Two ways of defining a low ratio are in common use, and they do not always agree:
- Lower limit of normal (LLN). The reference is the fifth percentile of a healthy population matched for age, sex, height and ethnicity, so the same person can be abnormal at 20 and normal at 80. [1][2] Current guidance would use LLN rather than a fixed cut-off. [1][2]
- Fixed ratio. In COPD diagnosis a post-bronchodilator FEV1/FVC less than 0.70 is the conventional threshold for airflow obstruction. [4] It is simple and works reasonably in older adults, but it over-diagnoses obstruction in young adults and under-diagnoses it in the very old. [2][4]
The two are reconciled in practice by reading the ratio against prediction equations and by looking at the rest of the test; the LLN is preferred for physiological diagnosis, and the 0.70 ratio is the practical entry criterion used by the COPD guidelines. [2][4]
Which reference equations? The Global Lung Function Initiative (GLI) published multi-ethnic reference equations in 2012 covering 3 to 95 years, and normal values are expressed as z-scores, so the spread of healthy values is taken into account. [2][10] Modern interpretation reports the FEV1 z-score rather than "percent of predicted" alone. [2]
Race and ethnicity. Older equations such as NHANES III gave different predicted values by race, and the GLI equivalents did the same. Current international guidance recommends a single, race-neutral average equation (GLI Global) because race is a social, not biological, variable and race-specific equations can entrench inequity. [2] The change is not cost-free: applying a single equation reclassifies some patients, and factors such as socioeconomic status and early-life exposures are themselves confounders, so results near the lower limit must be interpreted cautiously. [2] A practical approach is to interpret the number, then use clinical context, imaging and repeat testing where a result is borderline. [2]
An obstructive defect is present when the FEV1 is reduced out of proportion to the FVC, so the FEV1/FVC ratio is below the lower limit of normal (or below 0.70 on the COPD definition). [9][4] Emptying is slow because of narrowed or collapsible airways or loss of elastic recoil. [3] Typical causes are:
- asthma
- chronic obstructive pulmonary disease
- bronchiectasis
- cystic fibrosis
- bronchiolitis (including post-infectious and obliterative forms)
A reduced FEV1 can also fall in restriction, so the ratio is the pivot point. [9] Post-bronchodilator values are important: persistent obstruction after a bronchodilator favours COPD or structural disease, whereas large, reversible responses favour asthma. [1][5]
A restrictive defect is a small lung: reduced FVC and FEV1 with a preserved FEV1/FVC ratio. [9] Spirometry alone cannot confirm restriction; the total lung capacity must be low, otherwise the picture may simply be poor effort, air trapping, or a large airway lesion. [3][9] Common groups of causes are:
- Intrinsic (parenchymal) lung disease - interstitial fibrosis, sarcoidosis, pneumoconiosis, drug-induced injury, chronic infection, pulmonary oedema.
- Chest wall and pleural disease - kyphoscoliosis, ankylosing spondylitis, morbid obesity, pleural effusion, fibrothorax, post-pleurodesis.
- Neuromuscular and chest pump disease - diaphragm paralysis, motor neurone disease, myasthenia gravis, muscular dystrophy, high spinal cord lesions.
- Other - pregnancy and ascites push the diaphragm up and reduce the functional reserve; massive splenomegaly can do the same.
Body plethysmography (rather than gas dilution) is preferred when restriction is suspected to coexist with airway disease, because gas-dilution techniques may miss gas trapped behind closed airways and underestimate true volume. [3]
| Measure | Obstructive | Restrictive |
|---|---|---|
| FEV1/FVC ratio | Reduced (below the lower limit of normal, or below 0.70 on the COPD definition)[9][4] | Normal or increased[9] |
| FEV1 | Reduced, out of proportion to the FVC | Reduced in proportion to the FVC |
| FVC | Normal or mildly reduced | Reduced[9] |
| Total lung capacity (TLC) | Normal or raised (hyperinflation) | Reduced; needed to confirm restriction[3][9] |
| Residual volume and functional residual capacity (FRC) | Raised (air trapping) | Reduced or normal |
A reversibility test measures whether airflow improves after an inhaled bronchodilator. It is used to support a diagnosis of asthma, to assess COPD, and to decide treatment. [1][5]
Baseline spirometry is performed, a bronchodilator is given (typically a short-acting beta-2 agonist by spacer), and spirometry is repeated after the standard interval for that drug. [1][5] Medication is withheld beforehand according to the table above. [1]
A positive bronchodilator response is defined as an increase in FEV1 or FVC of at least 12% and at least 200 mL from baseline. [5] Both parts of the definition matter: a 15% rise of only 80 mL, or a 250 mL rise of only 4%, does not count. [5] In severe obstruction the FVC often responds more than the FEV1, so a rise in FVC alone can be clinically real and should not be dismissed. [5]
A positive result favours asthma but is not specific. Many people with COPD show some reversibility; in practice the post-bronchodilator values are used as the reference set, and the distinction is made on the whole clinical picture, not on the size of the response alone. [1][5]
Figure 3Flow-volume loop in restrictive lung disease
Long description
Flow on the vertical axis, expiration above and inspiration below the horizontal line; volume on the horizontal axis falling from total lung capacity at the left to residual volume at the right. The dashed normal loop is wide and tall with a high peak. The solid restrictive loop is narrower and shorter, starts further to the right, and has a steep, almost straight expiratory limb with no scooping.
Figure 4Flow-volume-loop
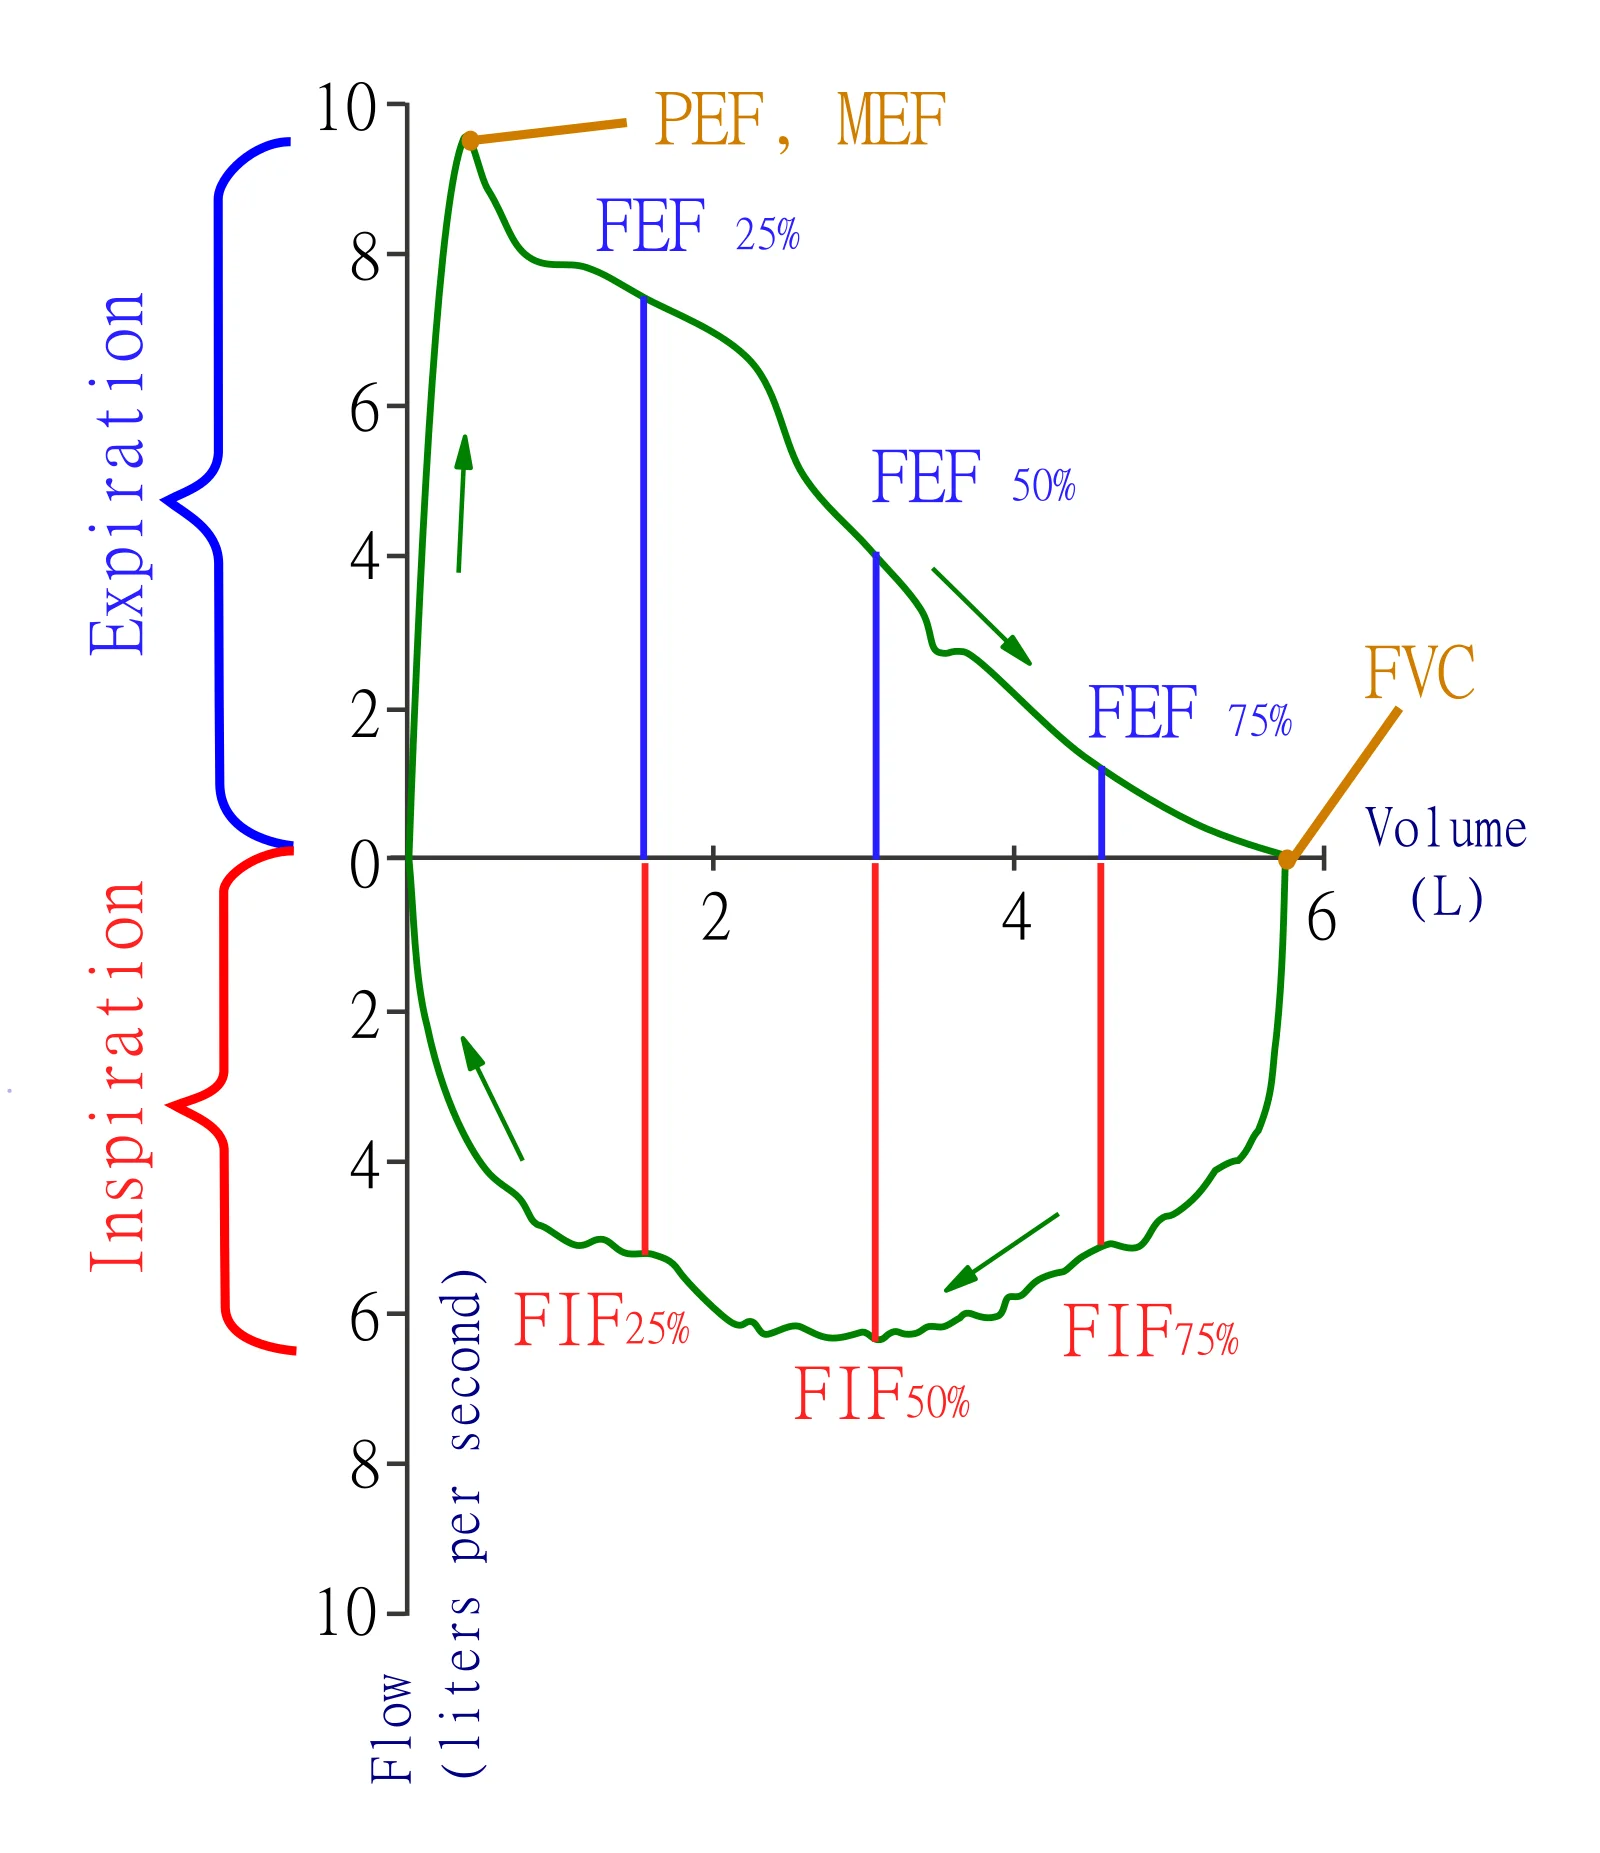
Long description
A vector flow-volume loop diagram with axes in litres per second and litres, labelled with FVC, PEF/MEF, FEF25/50/75 and FIF25/50/75.

Figure 5COPD
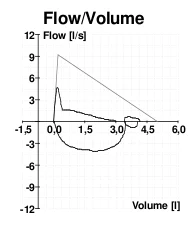
Long description
Flow-volume curve in COPD: scooped expiratory limb well below the predicted triangle.

A flow-volume loop plots instantaneous airflow against lung volume during a forced inspiration and expiration, and the shape is often more informative than the numbers. [3]
| Pattern | Shape | Typical meaning |
|---|---|---|
| Normal | Rapid peak in the first part of expiration, then an almost linear fall to residual volume. | Healthy lungs. [3] |
| Obstructive | Diminished peak flow with an exaggerated, scooped concavity of the descending expiratory limb; the curve bulges inward. | Airway obstruction; may be present even when FVC and FEV1 are still normal. [3] |
| Restrictive | Tall and narrow loop, with a relatively preserved peak flow and a steep linear fall; looks like a miniaturised normal loop. | Reduced compliance/limited expansion. [3] |
| Fixed upper airway obstruction | Flat plateau on both the inspiratory and expiratory limbs. | A rigid narrowing such as tracheal stenosis. [3] |
| Variable extrathoracic obstruction | Flattening of the inspiratory limb only. | A lesion in the neck or extrathoracic trachea that closes during inhalation. [3] |
| Variable intrathoracic obstruction | Flattening or plateau on the expiratory limb only. | A tracheal lesion below the thoracic inlet that closes during exhalation. [3] |
Upper-airway lesions are easy to miss because ordinary spirometry looks normal apart from the shape; the loop should be inspected in every patient with stridor or with airflow obstruction that does not fit. [3]
DLCO (also written D_LCO or transfer factor, TLCO) measures the uptake of a very low concentration of inhaled carbon monoxide during a single breath, corrected for the alveolar volume reached and for haemoglobin concentration. [3] It reflects the integrity of the alveolar-capillary surface and the pulmonary blood volume. [3]
- A raised DLCO can be caused by increased pulmonary capillary blood volume: recumbent posture, pregnancy, obesity, and congestive heart failure all raise it. Some intrinsic lung diseases also raise blood volume in the lung, notably asthma and (classically) diffuse alveolar haemorrhage. [3]
- A low DLCO is produced by most processes that involve the pulmonary capillaries: emphysema, interstitial lung disease, pulmonary vascular disease, and most chronic parenchymal processes. Severe anaemia also lowers it, which must not be mistaken for lung disease; correcting for haemoglobin is therefore essential. [3] Poor mixing of inspired gas in severe airway obstruction can also depress the measurement artificially. [3]
- Altitude and oxygen matter: breathing 100% oxygen or an enriched mixture before the test lowers the DLCO; at least 20 minutes of room air should precede the test. [3] High altitude raises it. [3]
A normal or raised DLCO in a patient with airflow obstruction points away from emphysema and towards asthma or chronic bronchitis; a low DLCO in restrictive disease points to a parenchymal or pulmonary-vascular cause rather than a chest-wall or neuromuscular one. [3]
When baseline spirometry is normal but symptoms suggest asthma, the question is whether the airways are hyperresponsive. Bronchial provocation testing (bronchial challenge testing) answers it by giving a stimulus and measuring the resulting change in FEV1. [7][9]
- Direct challenges use pharmacological agents such as methacholine or histamine.
- Indirect challenges use exercise, cold air, eucapnic hyperventilation or mannitol, and they reflect the mechanisms that provoke real asthma. [7][9]
A fall in FEV1 of 20% or more after methacholine inhalation is a widely accepted criterion for bronchial hyperresponsiveness. [7] The result is also reported as the provocative concentration or dose that produces a 20% fall (PC20, PD20). [7]
The test must be done by trained staff with resuscitation equipment present, because bronchospasm can be provoked. It is unsafe in severe baseline obstruction or in patients with significant heart disease, and the referring clinician should specify whether regular asthma treatment is to be stopped beforehand. [7][3]
The following is a teaching algorithm for approaching a full set of pulmonary function tests. [9][8]
Interpreting a set of pulmonary function tests
- Clinical question and valid historySymptoms, exposures, comorbidity, medication and bronchodilator withholding; confirm a good test by quality grade.
- Perform spirometry firstFVC, FEV1, FEV1/FVC ratio; inspect the flow-volume loop for shape, not only numbers.
- Question: Is FEV1/FVC below the lower limit of normal (or under 0.70 after a bronchodilator)?
Yes - obstruction
- Bronchodilator responsiveness testCheck for an FEV1 or FVC rise of 12% and 200 mL or more; interpret with the clinical picture.
- Classify the causeAsthma, COPD, bronchiectasis, cystic fibrosis, bronchiolitis; upper-airway obstruction if the loop is plateaued. Consider DLCO.
- Escalate or referSevere obstruction, unexpected findings, or results that do not fit the symptoms.
No - volumes normal or low
- Question: Is FVC reduced below the lower limit of normal?
Yes
- Measure lung volumes (TLC)Plethysmography preferred if airway disease is possible; gas dilution otherwise.
- Question: Is TLC reduced?
Yes - restriction
- Investigate the cause groupParenchymal (interstitial disease), chest wall and pleural, neuromuscular, obesity, pregnancy or ascites; add DLCO.
No
- Poor effort, early obstruction, or non-pulmonary causeRepeat with coaching; consider small-airway tests and DLCO.
No - spirometry normal
- Match result to the questionNormal spirometry does not exclude early or variable disease. Consider bronchodilator testing, provocation testing or DLCO, and an arterial blood gas if hypoxaemia or hypercapnia is suspected.
- Document quality grade and predicted-value source (GLI) and arrange follow-upRepeat testing to track treatment and decline; compare with the patient's own baseline rather than a single normal range.
An arterial blood gas measures the pH, the partial pressure of oxygen (PaO2) and carbon dioxide (PaCO2), and the bicarbonate concentration in arterial blood, plus oxygen saturation. [8] Capillary or venous samples are not the same and can mislead. [8]
Typical reference values are a pH of 7.35 to 7.45, PaCO2 of 35 to 45 mmHg, bicarbonate of 22 to 26 mEq/L, and PaO2 of 75 to 100 mmHg. [8] Acid-base status is read from the pH. The Henderson-Hasselbalch relationship means that the pH depends on the ratio of bicarbonate to dissolved carbon dioxide, not on their absolute values. [8] Buffer systems (mainly the bicarbonate/carbonic acid pair) keep that ratio stable day to day. [8]
Two mnemonics are widely used. ROME: in Respiratory disorders the pH and PaCO2 move in Opposite directions; in Metabolic disorders the pH and bicarbonate move in the Same (Equal) direction. [8] The four primary disorders and their compensation are:
| Disorder | pH | Primary change | Compensation | Common examples |
|---|---|---|---|---|
| Metabolic acidosis | under 7.35 | Bicarbonate under 22 mEq/L | Hyperventilation; PaCO2 falls (expected PaCO2 = 1.5 x [HCO3] + 8, plus or minus 2) | Diabetic ketoacidosis, lactic acidosis, renal failure, diarrhoea, poisoning [8] |
| Metabolic alkalosis | over 7.45 | Bicarbonate over 26 mEq/L | Hypoventilation; PaCO2 rises (0.7 x change in [HCO3] + 40, plus or minus 5) | Vomiting, diuretics, hyperaldosteronism [8] |
| Respiratory acidosis | under 7.35 | PaCO2 over 45 mmHg | Renal bicarbonate retention (acute 0.1 x change in PaCO2; chronic 0.4 x change) | COPD, pneumonia, opioids, central nervous system depression [8] |
| Respiratory alkalosis | over 7.45 | PaCO2 under 35 mmHg | Renal bicarbonate loss (acute 0.2 x change in PaCO2; chronic 0.5 x change) | Anxiety, pain, hypoxia, sepsis, pregnancy [8] |
The anion gap (sodium minus the sum of chloride and bicarbonate, normally 8 to 16) separates a high-gap metabolic acidosis (ketoacidosis, lactic acidosis, renal failure, poisoning) from a normal-gap acidosis (diarrhoea, renal tubular acidosis). [8] Mixed disorders occur when compensation is inadequate or excessive, and the measured pH then lies between the two predicted values. [8]
When laboratory lung function testing is not available, the same questions can be answered well enough to guide care with simpler tools. [3][9]
- Peak flow meters. These are cheap, pocket-sized, and measure the maximum speed of an exhaled breath. They are effort-dependent and are best used in asthma to confirm variable obstruction, to set a written action plan based on the patient's personal best, and to monitor treatment, rather than as a diagnostic test on their own. [3][9]
- Handheld and portable spirometers. Modern devices measure FEV1 and the ratio in primary care or outreach settings. A reading is only as good as the coaching: the device still needs calibration, a nose clip, and repeated acceptable manoeuvres, and it can underestimate FVC if the patient stops early. [1][9]
- Where plethysmography and gas dilution are unavailable, total lung capacity cannot be measured directly, so restriction is inferred from a reduced FVC with a preserved ratio and an examination that fits; chest-wall or neuromuscular causes should not be missed. [3][9]
- Oximetry and clinical assessment substitute for an ABG in many settings. Cyanosis, drowsiness and asterixis suggest CO2 retention, and a normal pulse oximetry reading does not rule out hypercapnia. [8]
- Bronchodilator withholding and spacing are the same everywhere; giving the drug on arrival and re-testing later loses the diagnostic information that the test exists to provide. [1]
Pulmonary function testing is safe. After a prolonged session patients may be tired and thirsty; a short rest and a drink are usually enough. [3] Possible problems include bronchospasm induced by forceful expiration (treat with a bronchodilator), dizziness or syncope from hyperventilation, mouth soreness from the mouthpiece, and nausea after contrast-free measurements. [1][3] Bronchial challenge testing is the only component with a real risk of induced bronchospasm, which is why it is performed under direct supervision with resuscitation equipment ready. [7][3]
Report the quality grade, the prediction equation used (and its population), and the values consistently. Because biological variability is large, comparison with the patient's own earlier results is often more useful than comparison with a single reference range. [1][2]
- PFTs measure lung volumes, airflow, gas transfer and (when combined with an ABG) acid-base status. [3][8]
- Spirometry gives FVC, FEV1 and the FEV1/FVC ratio; a low ratio indicates obstruction. [9]
- A preserved ratio with reduced FVC raises the possibility of restriction, which only TLC measurement can confirm. [9]
- Use the lower limit of normal (about the fifth percentile) from prediction equations, not 80% of predicted. [1][2]
- The GOLD definition of COPD uses a post-bronchodilator FEV1/FVC ratio under 0.7; this fixed ratio disagrees with the LLN at the extremes of age. [2][4]
- GLI equations cover ages 3 to 95 years; current guidance favours the race-neutral GLI Global average equation. [2][10]
- Lung volumes can only be measured directly by body plethysmography or gas dilution; spirometry measures the air that moves. [3]
- Obstruction is caused by asthma, COPD, bronchiectasis, cystic fibrosis and bronchiolitis; restriction by parenchymal, chest-wall, pleural and neuromuscular disease, and obesity. [3][9]
- Reversibility is a rise in FEV1 or FVC of at least 12% and at least 200 mL, and must be interpreted in its clinical context. [5]
- Flow-volume shapes (obstructive scooped, restrictive narrow, fixed upper airway plateau, variable extrathoracic inspiratory and intrathoracic expiratory) often give the diagnosis. [3]
- A low DLCO suggests parenchymal or pulmonary-vascular disease; a raised DLCO is seen with increased capillary blood volume, asthma and alveolar haemorrhage. [3]
- A fall in FEV1 of 20% or more after methacholine defines bronchial hyperresponsiveness. [7]
- Normal ABG values: pH 7.35 to 7.45, PaCO2 35 to 45 mmHg, bicarbonate 22 to 26 mEq/L, PaO2 75 to 100 mmHg. [8]
- Peak flow meters and handheld spirometers extend PFTs to low-resource settings, but coaching and quality control still matter. [1][9]
Answer each one in your head first, then open the answer.
A 62-year-old smoker has a post-bronchodilator FEV1/FVC of 0.62, FEV1 58% of predicted and no reversibility. Which pattern is present, and what is the most likely group of diseases?
Show answerHide answer
Obstructive pattern. The fixed 0.7 ratio is under 0.7 and the FEV1 is reduced; persistent obstruction after a bronchodilator in a smoker favours COPD over asthma. Asthma remains a differential if there is significant variability or eosinophilic inflammation.
Why is a vital capacity of 3.8 L sometimes reported as normal and sometimes as restricted?
Show answerHide answer
Because normal depends on age, sex, height and ethnicity through prediction equations. A value is abnormal only when it is below the lower limit of normal for that individual, not when it falls below an arbitrary percentage of predicted. Restriction specifically requires a reduced total lung capacity as well.
A patient's FEV1 rises from 1.70 L to 1.90 L after salbutamol. Does that meet the criteria for bronchodilator responsiveness?
Show answerHide answer
No. The rise is 0.20 L (200 mL) and about 12%, so it is right on both; 0.20 L equals 200 mL and 0.20/1.70 is about 11.8%, just short of 12%. It would need an increase of 0.204 L (12%) to qualify. If repeated testing gives a slightly larger rise, the response would be positive.
A patient with diffuse parenchymal lung disease has a low FVC and a normal FEV1/FVC. What additional measurement distinguishes true restriction from poor effort, and what would it show?
Show answerHide answer
Total lung capacity measured by body plethysmography or gas dilution. It will be below the lower limit of normal in true restriction; it will be normal in poor effort or in conditions with premature airway closure.
Which flow-volume loop shape is produced by a fixed stenosis of the trachea, and which shape by a lesion outside the thoracic inlet?
Show answerHide answer
A fixed upper airway obstruction produces a flat plateau on both inspiratory and expiratory limbs. An extrathoracic variable obstruction flattens the inspiratory limb only, because the lesion is sucked closed during inhalation.
A woman with interstitial lung disease has a low DLCO; her spirometry is restrictive. A second woman with inspiratory muscle weakness has equally low FVC. What would you expect their DLCO values to be, and why does it matter?
Show answerHide answer
The first will have a low DLCO, because the alveolar-capillary surface is diseased. The second should have a normal or near-normal DLCO, because the lungs themselves are intact. The distinction directs investigation toward parenchymal or pulmonary-vascular disease in the first and toward neuromuscular causes in the second.
What is the simplest useful test for asthma monitoring in a clinic that has no spirometer, and how should it be used?
Show answerHide answer
A peak flow meter. It is effort-dependent and best used to confirm variable obstruction, to set a written action plan from the patient's personal best, and to monitor treatment response, rather than as a stand-alone diagnostic test.
Asthma; chronic obstructive pulmonary disease; bronchiectasis; cystic fibrosis; bronchiolitis; sleep-disordered breathing; arterial blood gases; acid-base disorders; interstitial lung disease; respiratory failure.
Asthma
A chronic inflammatory airway disease causing wheeze and breathlessness, with reversible obstruction; modern stepwise management and acute care.Chronic obstructive pulmonary disease (COPD)
Chronic lung disease with persistent airflow obstruction: clinical features, diagnosis, staging, management and complications.Interstitial lung disease
A restrictive interstitial lung disease: how idiopathic pulmonary fibrosis and other causes are classified, diagnosed, and managed.
4 other topics link here.
- Miller MR, Hankinson J, Brusasco V, Burgos F, Casaburi R, Coates A, et al. Standardization of Spirometry 2019 Update. An Official American Thoracic Society and European Respiratory Society Technical Statement.. Am J Respir Crit Care Med 2019;200(8):e70-e88. Accessed .
- Bhakta NR, Bime C, Kaminsky DA, et al. Race and Ethnicity in Pulmonary Function Test Interpretation: An Official American Thoracic Society Statement.. Am J Respir Crit Care Med 2023;207(8):978-997. Accessed .
- Gold WM, Koth LL. Pulmonary Function Testing (chapter in Murray and Nadel's Textbook of Respiratory Medicine, 6th ed.). Elsevier 2016, pp. 407-435. Accessed .
- GOLD Science Committee. GOLD Science Committee recommendations for the use of pre- and post-bronchodilator spirometry for the diagnosis of COPD.. Eur Respir J 2025. Accessed .
- Barjaktarevic I, Kaner R, Buhr RG, Cooper CB. Bronchodilator responsiveness or reversibility in asthma and COPD - a need for clarity. Int J Chron Obstruct Pulmon Dis 2018;13:3511-3513. Accessed .
- OpenStax. Anatomy and Physiology, 22.3 The Process of Breathing. OpenStax, Rice University, 2016 (CC BY 4.0). Accessed .
- Park S, Yi Y, Han SS, et al. Development of an AI Model for Predicting Methacholine Bronchial Provocation Test Results Using Spirometry. Diagnostics (Basel) 2025;15(4):449. Accessed .
- Sanagustín MN, Osredkar J. Blood gas analysis: clinical applications, interpretation and future directions (Review).. Med Int (Lond) 2025;6(1):7. Accessed .
- Martínez-Fernández T, Rivera-Sánchez Y, Sharma P, et al. Pulmonology. Elsevier 2019. Accessed .
- Quanjer PH, Stanojevic S, Cole TJ, et al. Multi-ethnic reference values for spirometry for the 3-95-yr age range: the global lung function 2012 equations.. Eur Respir J 2012;40(6):1324-1343. Accessed .
Figure credits
- Figure 1: LungVolume.jpg: The original uploader was Vihsadas at English Wikipedia. derivative work: rscottweekly, via Wikimedia Commons, CC BY-SA 3.0, CC BY-SA 3.0.
- Figure 2: Raimundo Pastor, via Wikimedia Commons, CC BY-SA 3.0, CC BY-SA 3.0.
- Figure 3: Original illustration by MedGrasp, CC BY 4.0.
- Figure 4: SPhotographer, Jmarchn, via Wikimedia Commons, CC BY-SA 3.0, CC BY-SA 3.0.
- Figure 5: Evgenios Metaxas MD MSc, Pulmonologist Ευγένιος Μεταξάς MD MSc, Πνευμονολόγος, via Wikimedia Commons, CC BY-SA 3.0, CC BY-SA 3.0.
Educational content for medical students and doctors. It is not a substitute for clinical judgement or local guidelines.